Explore SparkMap’s Map Room Tools
Our Map Room is equipped with a robust suite of tools built to help you learn more about your areas of interest, create effective visuals, and extract data from your maps. Check out descriptions of each Map Room Tool below.
Map Tools
Footprint Tools
Data Tools
Section 1 – Map Tools
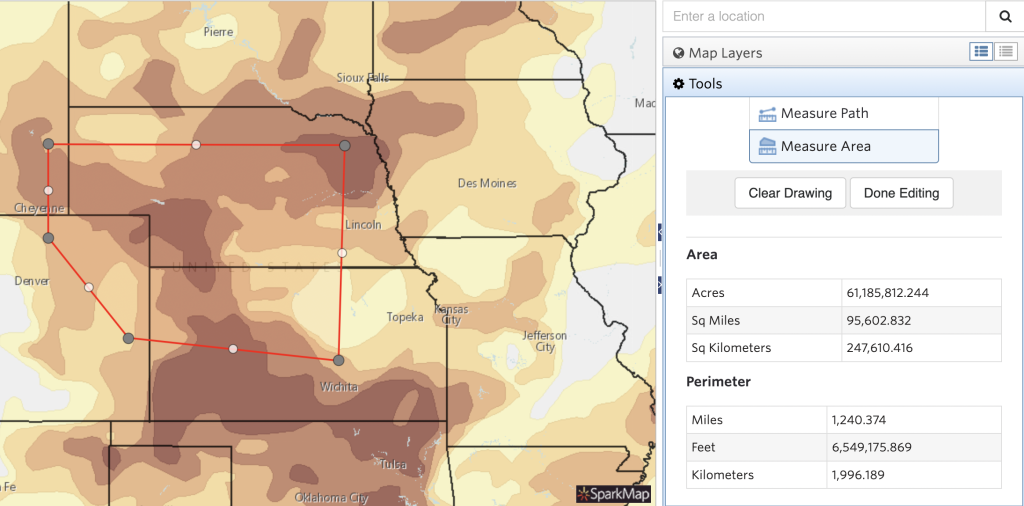
The Measure Tool helps you measure distance between geographic coordinates, path lengths, and area sizes at the click of a button. Learn more by checking out our tutorial, How to Use the Measure Tool.
The Draw Graphics Tool allows you to draw points, lines, and polygons on the surface of your map. Your markups remain visible when you download or share your map, making it easy to highlight specific information for presentations. Learn more by reading our tutorial, How to Use the Draw Graphics Tool.
The Mask Tool allows you to hide or lighten sections of your map, making it easier to highlight data of interest. Learn more by checking out our tutorial, How to Use the Mask Tool.
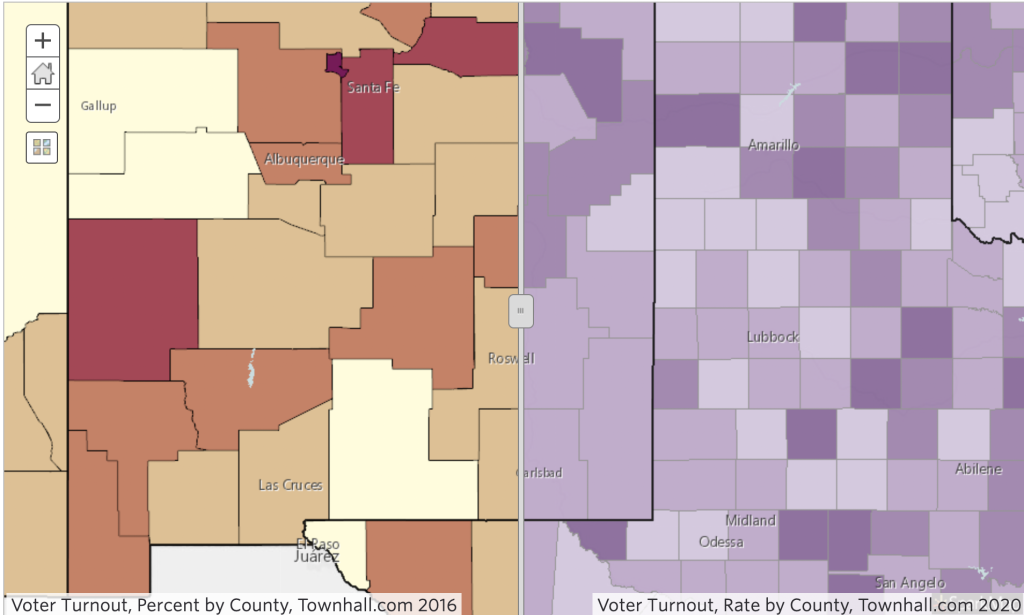
The Swipe Layer Tool allows you to swap between two data layers by “swiping” a bar across your map. This tool is particularly useful for showing off changes in data over time.
Need help using the Swipe Layer Tool? Check out our tutorial, How to Use the Swipe Layer Tool.
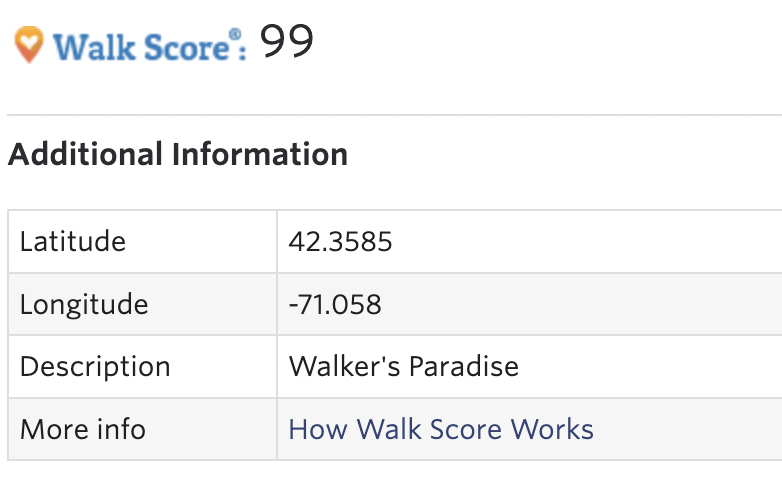
The Walk Score Tool allows you to learn more about an area’s walkability at the click of a button. After selecting the Walk Score Tool, click any area on your map to learn its walk score.
To learn more about Walk Scores, check out https://www.walkscore.com.
Section 2 – Footprint Tools
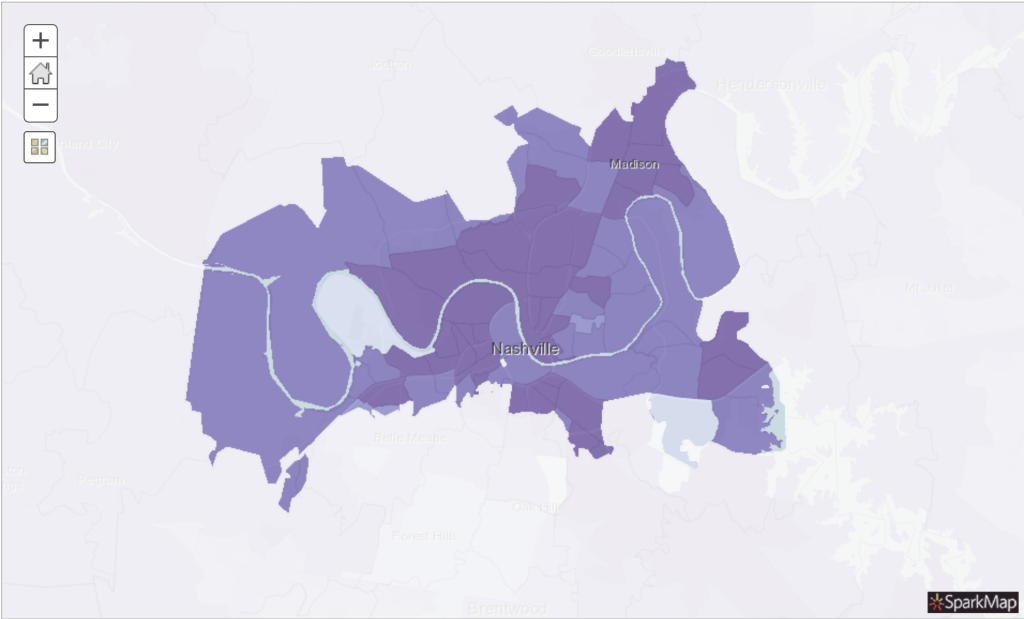
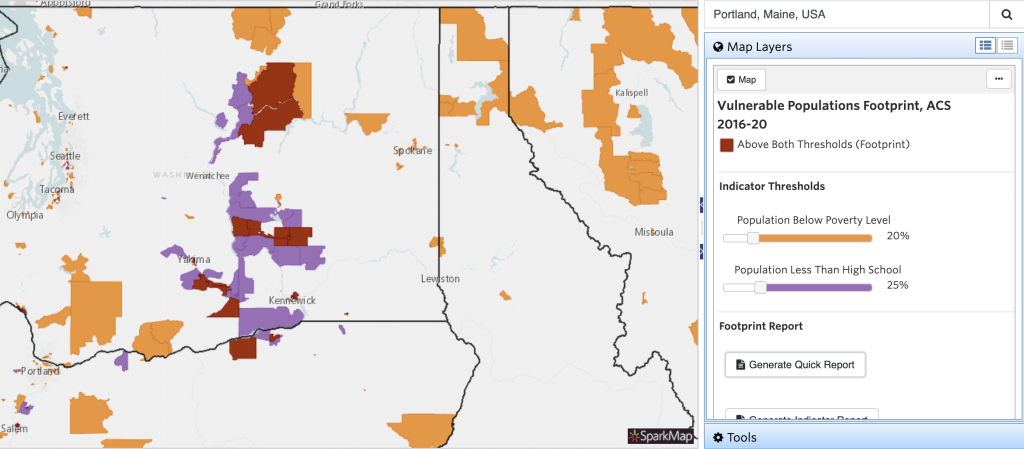
Use the Vulnerable Populations Footprint Tool (VPF) to display a map layer pinpointing populations in your community vulnerable to health-related disparities. The VPF also generates downloadable, location-specific reports.
Learn more about the Vulnerable Populations Footprint tool by checking out our Vulnerable Populations Footprint Tool tutorial.
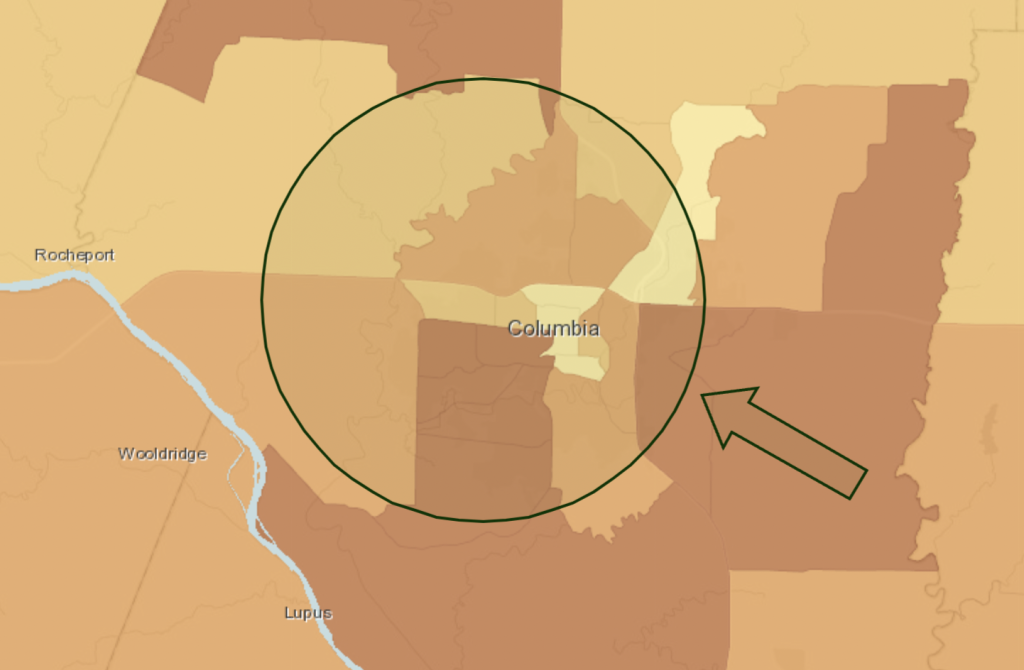
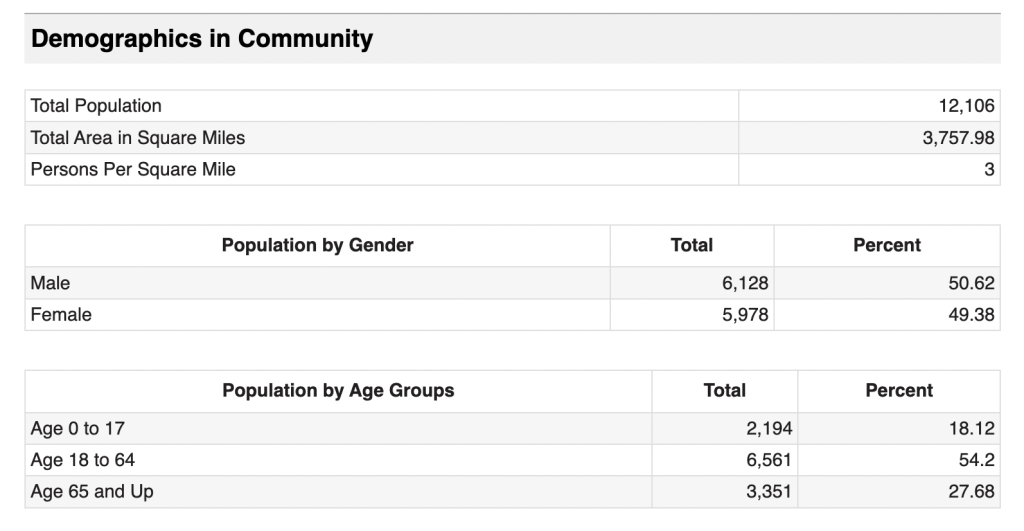
The Community Demographic Mapping Tool generates demographic reports for the location of your choice. In addition to demographic breakdowns, these reports provide an overview of poverty levels and educational attainment in your area.
Need help using the Community Demographic Mapping Tool? Check out our tutorial, How to Use the Community Demographic Mapping Tool.
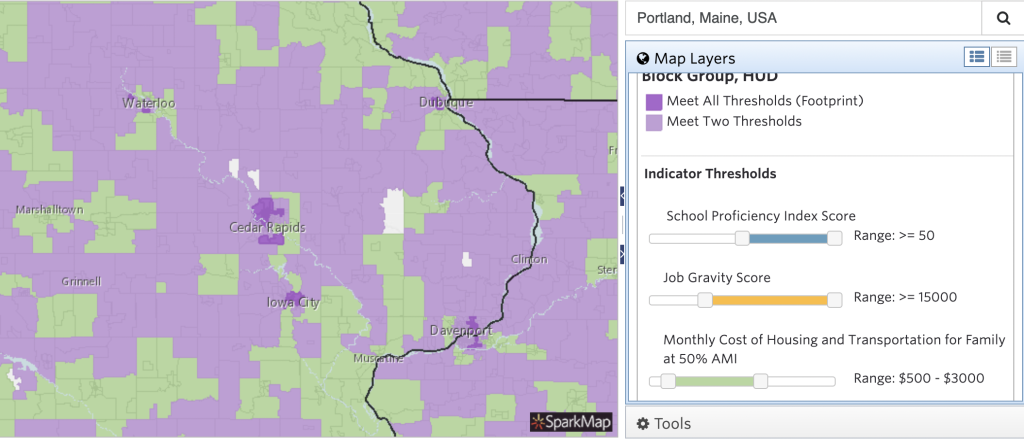
Use the Location Opportunity Footprint Tool (LOFT) to display a map layer highlighting your area’s affordability, job opportunities, and school systems. The LOFT also generates downloadable, location-specific reports.
Need help using the Location Opportunity Footprint Tool? Check out our tutorial, How to Use the Location Opportunity Footprint Tool.
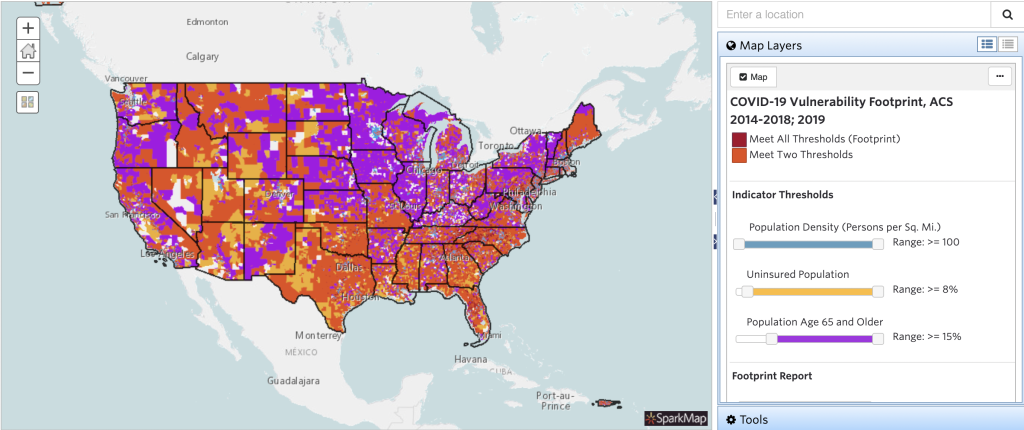
Use the COVID-19 Vulnerability Footprint Tool to generate a map layer highlighting your area’s population density, age ranges, and insurance access, three factors significantly impacting community vulnerability to COVID-19 outbreaks. The tool also generates downloadable, location-specific reports.
Need help using the COVID-19 Vulnerability Footprint Tool? Check out our tutorial, How to Use the COVID-19 Vulnerability Footprint Tool.
Section 3 – Data Tools
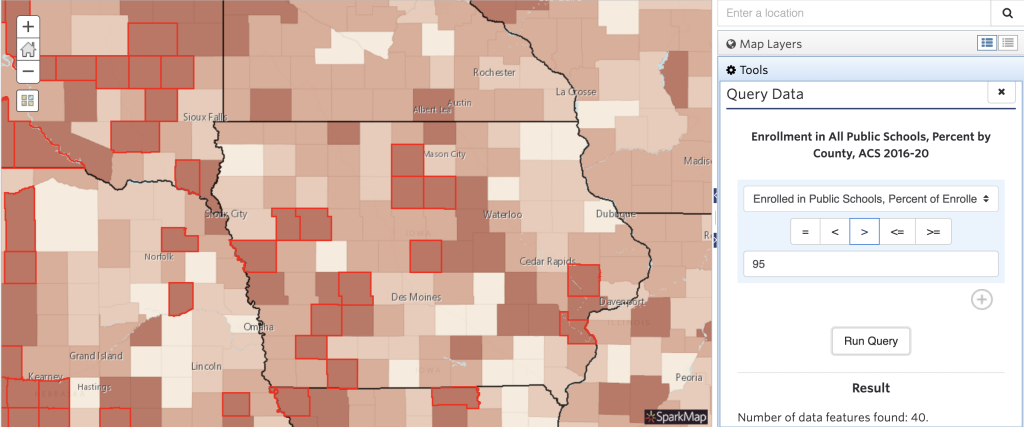
Use the Query Data Tool to identify geographic areas that meet, exceed, or fall below data thresholds of your choosing. In addition, the Query Data Tool serves as a means of converting Map Room data into tabular form, downloadable as a .csv file.
Need help using the Query Data Tool? Check out our tutorial, How to Use the Query Data Tool.
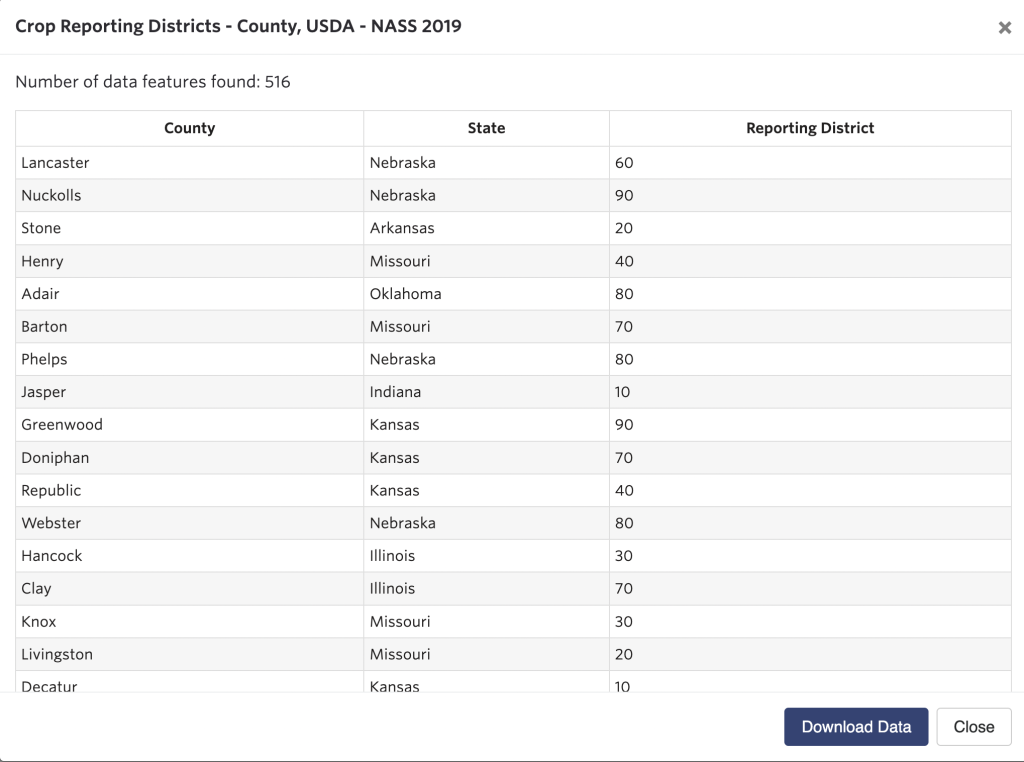
Use the Select Data Tool to convert Map Room data into tabular form, downloadable as a .csv file.
Need help using the Select Data Tool? Check out our tutorial, How to Use the Select Data Tool.
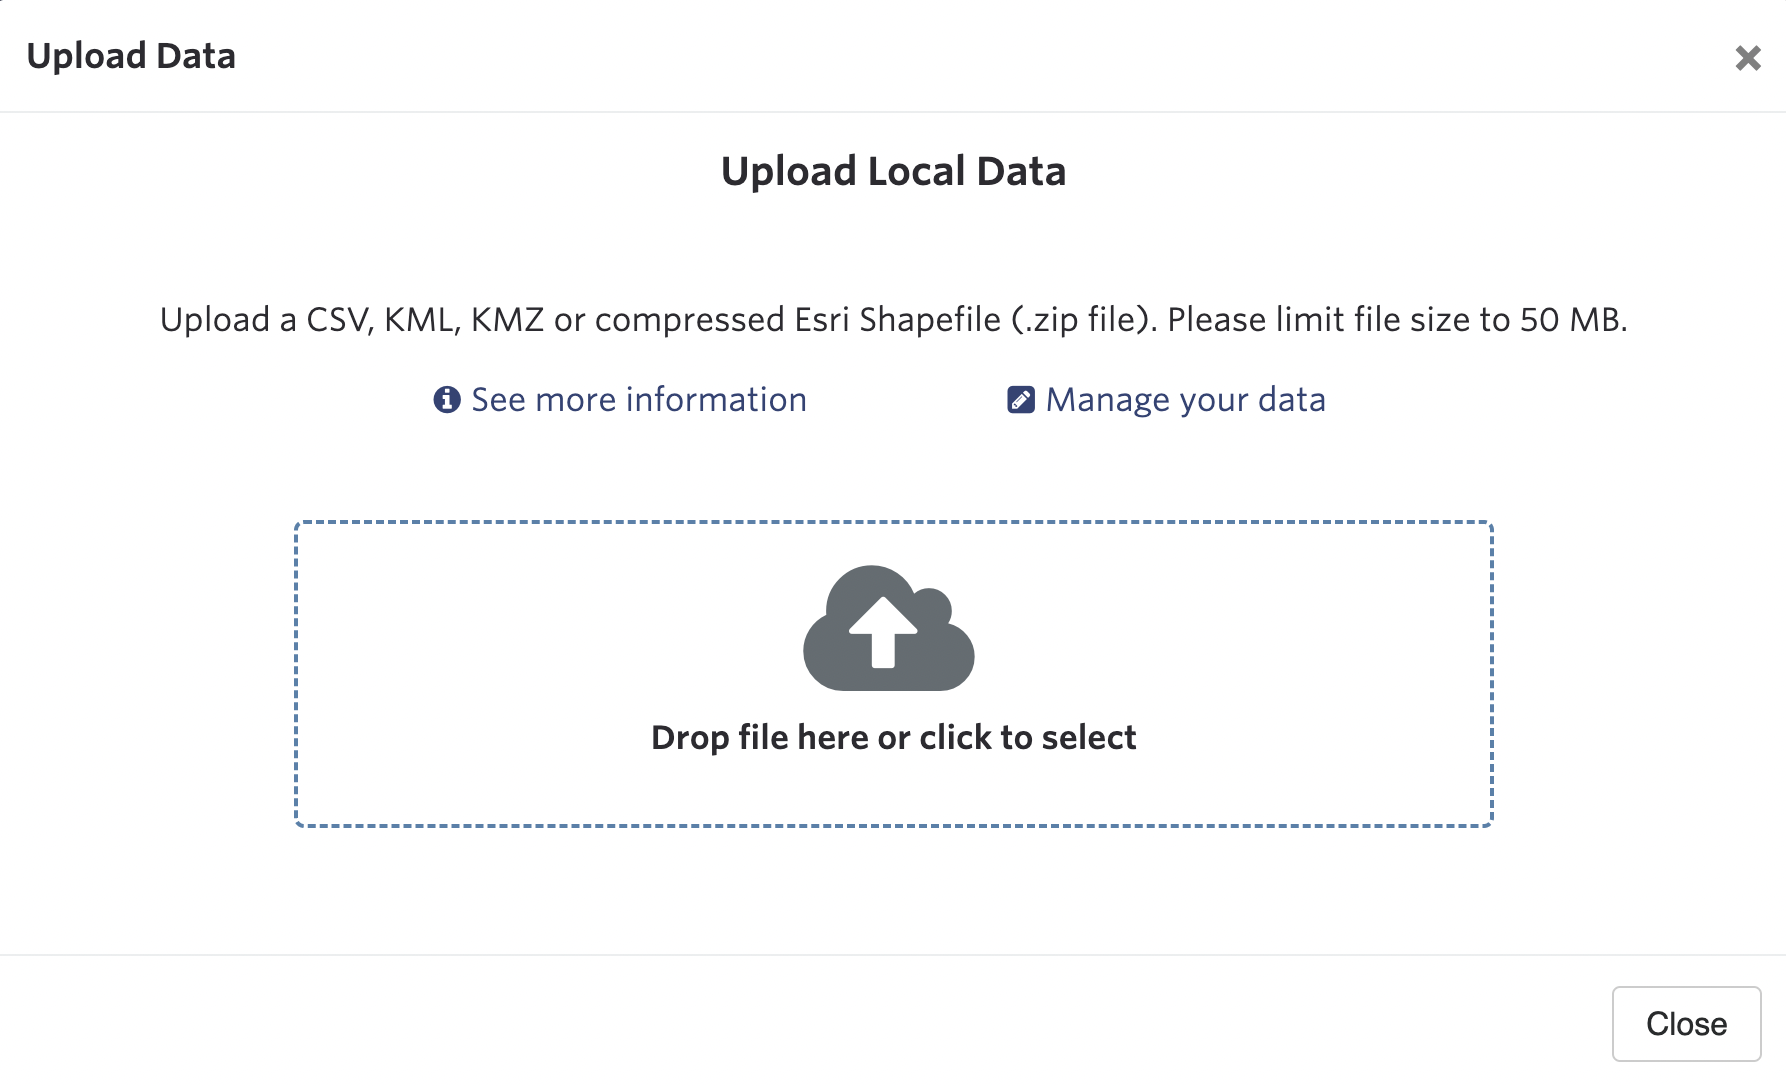
Available to Pro and Premium Subscribers, the Data Upload Tool allows you to upload your own data into the Map Room. This tool is compatible with CSV, KML/KMV, and shapefiles.
Need help using the Data Upload Tool? Check out our tutorial, How to Use the Data Upload Tool.
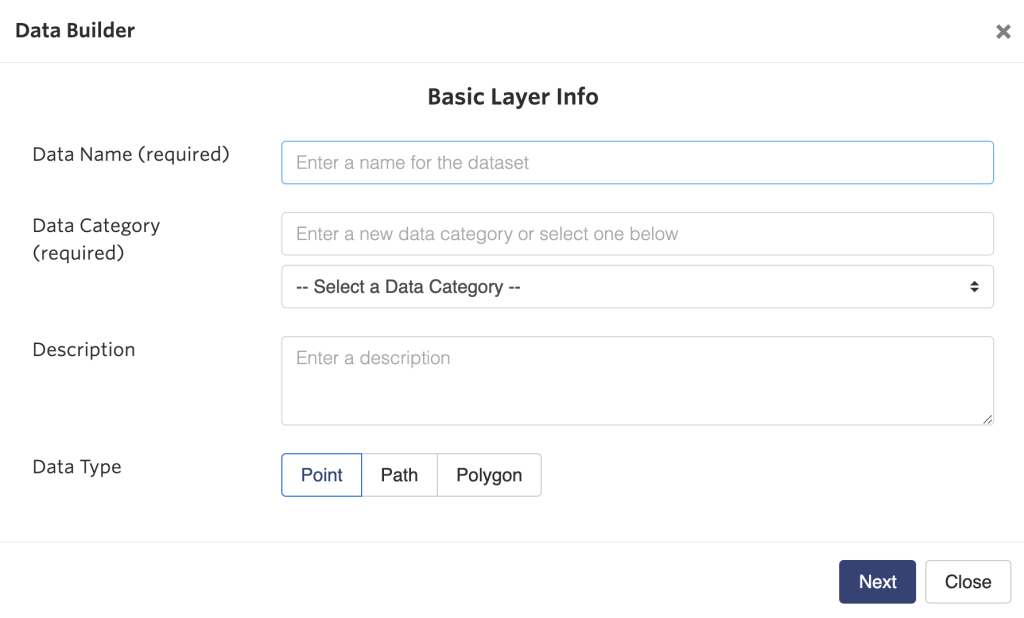
Available to Pro and Premium Subscribers, the Data Builder Tool allows you to create new layers inside the Map Room.
Need help using the Data Builder Tool? Check out our tutorial, How to use the Data Builder Tool.