The National Commodity Crop Productivity Index (NCCPI)
In this feature, we’re going to examine an agricultural dataset that we get asked about a lot at SparkMap: the National Commodity Crop Productivity Index (NCCPI). The NCCPI is a productivity model that ranks the inherent capacity of soils to produce crops without irrigation. It’s produced by the National Resources Conservation Service (NRCS), an agency of the United States Department of Agriculture (USDA) and is used widely for land valuation and management.1
Read on to learn:
- What’s so great about the NCCPI?
- What the NCCPI does (and what some limitations are).
- Where the soil data comes from.
- Getting down and dirty with NCCPI data on SparkMap.
What’s so Great about the NCCPI?
First, the NCCPI encompasses the entire country. In fact, the NCCPI uses soil survey data that are available in every county where commodity crops are grown. Not only is this data widespread, but the productivity model promotes consistent data across state and political boundaries. Additionally, the NCCPI uses enduring data, such as natural relationships of soil, landscape, and climate factors in its model. Crop varieties, management practices, and yields may vary, but inherent soil productivity doesn’t really change over time.
Although the output of the NCCPI’s productivity model focuses on specific commodity crops, according to the NRCS, the best soils for the growth of commodity crops generally are the best soils for the growth of other crops too.2
Who uses the NCCPI?
This dataset is widely used for setting land values and cash rental rates. Agronomists and conservators also use these data to identify land that may require alternative management practices. For example, land that consistently underperforms in crop production may be better suited for grazing or conservation.
Furthermore, the indices generated by the NCCPI model are used for USDA national conservation and Farm Bill programs, applications within other Federal agencies, and decision making by others involved in agriculture infrastructure.
What the NCCPI does (and some limitations)
The NCCPI essentially answers the question “how good is this soil for growing crops?”. The index provides a rating for soil productivity in non-irrigated commodity crops in a geographic area.
The NCCPI productivity ratings range from 0.01 to 1, with 1 being the most productive.3 As productivity during a single year may change greatly based on weather or management practices, the NCCPI model focuses on a relative productivity ranking over periods of years, not for a single year. This makes the data more reliable and provides more accurate evaluation of soil.
How does the NCCPI estimate soil performance?
A host of soil and climatic properties influence soil productivity. First, the ideal soil will retain water but not become saturated enough during the growing season to inhibit root growth – this ideal includes the soil’s inherent capabilities as well as flooding considerations. Composition of the soil is a major factor as well: ideal soil should lack toxins and lack barriers (physical or chemical) that would impede root growth. On the other hand, it should have a near-neutral pH and be able to store nutrients. Slope is also considered in soil assessment – slope affects erosion, water retention and runoff, as well as the operation of equipment. Finally, the climate itself must provide adequate water and heat for the desired crop. The more a soil diverges from any or all of the ideals above, the lower its inherent productivity.
The index currently models corn, soybeans, small grains, and cotton. These four crops are representative of very different soil and climatic conditions. For example, small grains provide an analogy for comparable crops in cooler, drier climates and shorter growing seasons. Cotton, however, is a unique crop requiring a very warm climate, one significantly warmer than that required for the production of corn and soybeans and much warmer than that required for the production of small grains.
Limitations in the NCCPI
The NCCPI then, is a reliable dataset for land evaluation. However, there are some limitations to consider. Sometimes, farmers and ranchers make decisions that compromise land quality – for example, in types of crops grown and how the land is managed. The NCCPI does not reflect these potential changes to the soil quality or productivity, or account for current land use. Additionally, the index does not account for plant growth attributes, such as day length.
Where the Soil Data Come From
To create a robust index, which is the goal of the NCCPI, the underlying data must be normalized. Additionally, to make a useful national soil index, the underlying data must span the entire country, must be produced using the same standards across the country, and must be highly detailed. The data in the National Soil Information System (NASIS), managed by the National Soil Survey Center (NSSC), fulfill these criteria and are therefore used to create the NCCPI.
To provide the soils data, the Natural Resources Conservation Service (NRCS) has a soil survey program across the United States, with rigorous standards for the data. According to the NCRS, “[a]mong other objectives, the NRCS soil survey program establishes and maintains standards for mapping, classification, correlation, interpretation, and other aspects of soil and ecological site survey in conjunction with NCSS partners.”4
The underlying NCCPI framework uses natural relationships of soil, landscape, and climate factors to model the response of commodity crops. In the NASIS interpretations generator, each soil, climate, or landscape characteristic is given a score by comparing its value to an optimum value. These scores are then manipulated in to produce the index.
For more information on how the index is derived, visit the User Guide for the National Commodity Crop Production Index.
Getting Down and Dirty with NCCPI on SparkMap
Now that you know the ins and outs of the NCCPI, how can you use SparkMap to enhance your land valuation and management experience? We see three main advantages to using NCCPI data in our Map Room: seeing the larger perspective, selecting custom NCCPI data, and downloading these data. Follow along on this interactive map.
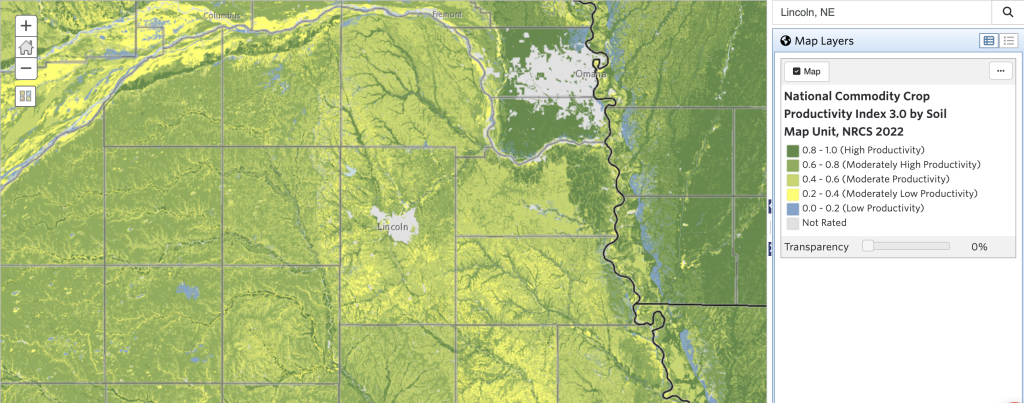
First, when you load the NCCPI layer into the SparkMap Map Room, you’re able to see the large-scale view of crop productivity around the nation. With our color-coded map, you can quickly spot areas of high and low productivity. As you zoom closer into your area of interest, you’ll see a more nuanced map of different crop productivity levels (Figure 1).
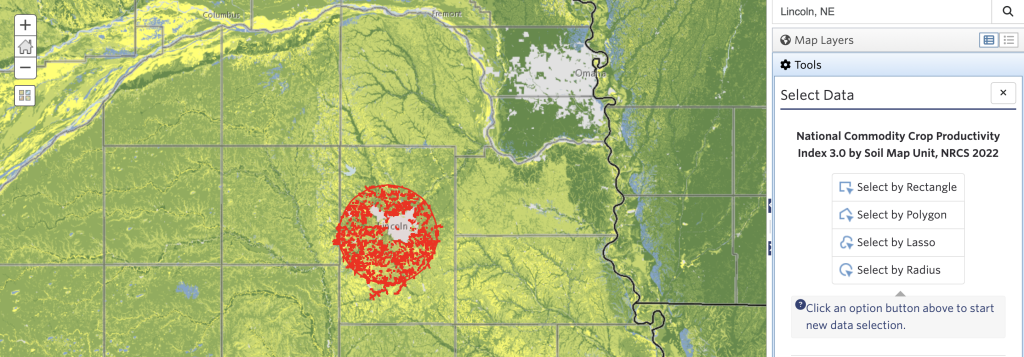
Second, once you’ve located an area of interest, it’s easy to use our custom tools to dig deeper. With our Select Data’s radius drawing tool, for example, you can easily assess crop productivity within a set distance of your selected area (See: How to Use the Select Data tool). We’ve decided to showcase what the map looks like when you set your radius to 10 miles (Figure 2).
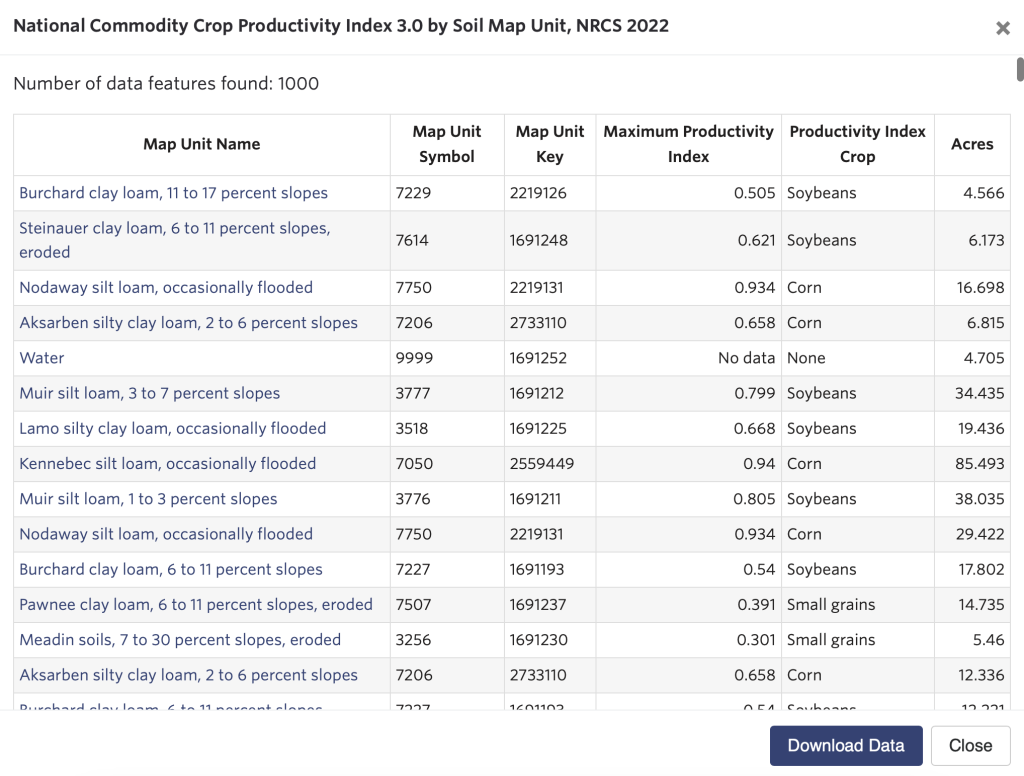
Lastly, an advantage of using SparkMap is that once you’ve selected a region using the Select Data tool, we generate a downloadable report with all of the pertinent metadata in it. In this report, you will find the map unit descriptions (including soil types and slope), maximum productivity index, productivity index crop, acreage, and more (Figure 3)!
In this post, we’ve covered lots of information about the NCCPI! Overall, this data set is critical for land evaluation and management. Using SparkMap tools, we hope to expedite your land surveying experience through the use of our Map Room and downloadable data report.
Updated 2/20/2023 to reflect National Commodity Crop Productivity Index 3.0 by Soil Map Unit, NRCS 2022 data update.
References
- NCCPI 3.0 info: https://www.nrcs.usda.gov/Internet/FSE_DOCUMENTS/nrcs142p2_050734.pdf
- Background of soil surveying in the US until 2007: https://pubs.usgs.gov/of/2008/1385/pdf/fortner.pdf
- https://www.landsofamerica.com/api/documents/3833030802/NCCPIOverallRating.pdf
- https://directives.sc.egov.usda.gov/RollupViewer.aspx?hid=16988