Blog
Agriculture Broadband Civil/Social Community Needs Assessment Data Economic Education Environment Health How To Map Room Product Updates Reference Special Topic Uncategorized Webinars
-
Data Dive: Social Security Beneficiaries
Over $1 trillion federal dollars are spent on Social Security each year. Read our latest blog to learn more about Old-Age, Survivors, and Disability benefits data.
-
Data Dive: State Cancer Profiles
Many types of cancer are on the rise. Learn more about how you can track cancer incidence with data from State Cancer Profiles.
-
Data Dive: Radon
Radon is the second leading cause of lung cancer in the US. Learn more about accessing and interpreting radon data in the Map Room and Community Needs Assessment in this Data Dive.
-
2025 Year in Review
Access to reliable data became more important than ever before in 2025. As questions rose around data availability, updates, and reliability, SparkMap remained your trusted data provider. We are proud to continue this mission into 2026 and partner with you on supporting the change you’re making in communities around the country. The year ahead will…
-
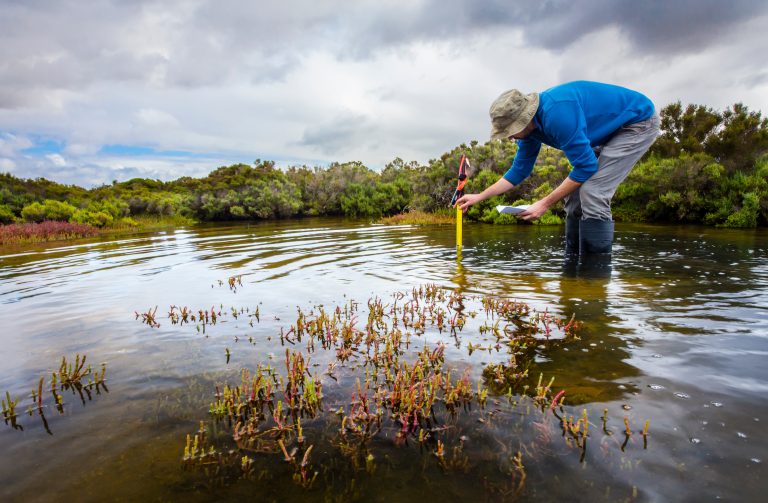
Conservation and Community Planning: Using Biodiversity, Water, and Soil Data
Incorporating conservation goals and data into community planning and assessments can be challenging. It can be equally difficult to find and interpret quality data related to conservation in a meaningful way. Adding to the complexity, conservation can also be a little ambiguous to define and may change depending on your goals. Are you conserving water?…
-
Identify Community Strengths and Opportunities
Learn about your community and make data-based decisions with our footprint tools: Community Demographic Mapping, Location Opportunity Footprint Tool, and Vulnerable Populations Footprint. Save time searching for information on the people who live and work in your community or service area with these tools.
-
2024 Year in Review
2024 was a record-breaking year at SparkMap! More of you joined SparkMap to understand and improve your communities than ever before, the SparkMap team introduced a new Map Room interface, and we created more streamlined and innovative tools to enhance your experience. While SparkMap grew and changed this year, one thing remained the same: our…
-
Data Dive: Federally Qualified Health Centers
In this blog we dive into six new indicators about Federally Qualified Health Centers in the SparkMap Community Needs Assessment.
-
Selecting Data for a CHNA: Five Best Practices
Community Health Needs Assessments (CHNAs) have evolved in many ways over the last ten years. We’re excited to share 5 best practices we’ve learned for selecting CHNA data.
-
Introducing the Beta Map Room
Explore the Beta Map Room with a full video demo!
-
Decoding Commuting Distance Patterns
Introduction Commuting has important implications for our health, environment, and economy as discussed in a previous blog post. To follow up on the previous piece, this post further explores commuting patterns by taking a closer look at commuting distances. We will highlight some new analyses and modeling done on publicly available commuting data to learn…
-
Data Dive: Diabetes Prevalence
In this Data Dive we explore diabetes prevalence data in the SparkMap Map Room and Community Needs Assessment. Dive in to learn more!
-
Poverty Awareness Month with SparkMap
January is Poverty in America Awareness Month. In 2022, 11.5% of Americans and 15% of children under the age of 18 lived below the federal poverty threshold. In this video, we show you poverty-specific indicators available on SparkMap, create a custom-area Community Needs Assessment, and examine how this data can serve as a foundation for…
-
SparkMap’s 2023 in Review
A record number of maps and Community Needs Assessments were created on SparkMap in 2023. Read more to learn about the top 5 layers and indicator categories utilized.
-
Data Dive: Air Quality
Learn more about two of SparkMap’s Air Quality data layers in this Data Dive. We explore both Ozone Levels and Particulate Matter (i.e., small particles in the air) as two indicators of community health.
-
Determine Social Vulnerability and Community Opportunities with SparkMap
In this video, you will learn how to assess the social vulnerability and opportunities within your community or service area. We explain two indices used for these purposes: the Social Vulnerability Index and the Opportunity Index and demonstrate them in our Community Needs Assessment. Then, we dive into three sub-indicators used in the Opportunity index…
-
All About Broadband
What is broadband and how can you learn more about it on SparkMap? In this blog post we walk you through defining broadband, understanding how a broadband connection is impacted, and using broadband data on SparkMap.
-
National Preparedness Month: Preparing for Older Adults
September is National Preparedness Month, and this year the focus is on Preparing for Older Adults. In this webinar, we highlight various FEMA disaster risk layers and live wildfire data available for free on SparkMap. Then, we examine a data layer aimed at estimating Community Resilience. Lastly, we walk through a case study to help…
-
Choosing Locations as a Digital Nomad
Two important criteria for Digital Nomads include reliable broadband access and affordable housing. In this blog post, learn more about how you can use the SparkMap Map Room to find communities that meet these criteria.
-
2020 Decennial Census of Population and Housing on SparkMap
In this webinar, we discuss background information on the United States Decennial Census, highlight multiple free layers available in the SparkMap Map room, and guide you through a use case using the Population Living in Group Quarters indicator in the Community Needs Assessment.
-
Where’s the Food? Part Two: Food Retailer Distribution Rates
This blog is part two of our Where’s the Food series. Our last blog, Where’s the Food? Part One: Finding and Using Data on Specific Food Retailer Locations discussed SparkMap’s USDA data on supermarket and farmer’s market locations. Now we’re shifting the focus to finding and utilizing data on food distribution rates. We will discuss: …
-
Measures of Race and Ethnicity: A Look at Shifting Demographics
In this SparkMap Webinar, we provide informative definitions of race and ethnicity and discuss the importance of population change to community development. We also highlight the changing landscape of race and ethnicity in the United States and why it’s important. We wrap up by demonstrating how to find and interpret demographics information in both the…
-
Community Determinants of Stress
Earlier this month, we wrote a blog highlighting four tips to reduce individual stress for yourself and your community members. Learning to manage stress is important, but understanding determinants of stress helps inspire long-term solutions. As National Stress Awareness Month comes to a close, we want to bring attention to a few determinants of stress…
-
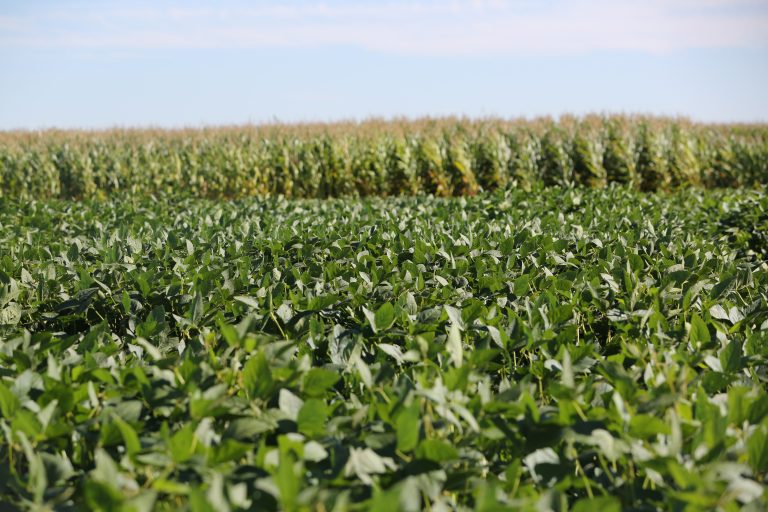
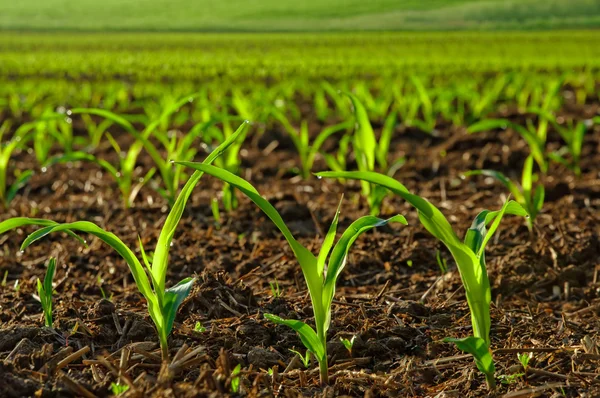
Digging in to Soil: The NCCPI 3.0 and Other Soil Layers
SparkMap is a useful tool for land valuation and management decisions with the NCCPI 3.0 and other soil layers. Using our free Map Room, visitors can easily access the National Commodity Crop Productivity Index 3.0, as well as layers related to soil boundaries, loss tolerance, taxonomy order, hydrologic soil group, and soil taxonomy order. Check…
-
Stress Management Resources for You and Your Community
April is interesting. On one hand, many parts of the United States are emerging from winter, the sun is out, and spring flowers are blooming. On the other hand, taxes are due, the traditional school year is ending, and work deadlines feel like they’re piling up. It seems like no coincidence that April is National…
-
Digging Deeper into the NCCPI 3.0
The National Commodity Crop Productivity Index 3.0 is an invaluable tool to evaluate soil productivity. In this blog we discuss background information on the index, reasons to use it, and how to interpret it in our Map Room.
-
SparkMap’s 2022 in Review
2022 was a big year at SparkMap, thanks to you! Internally, we added more members to our team, underwent a full site refresh to unveil in 2023, and developed more multimedia content to enhance your SparkMap experience. We weren’t the only ones busy on SparkMap this year! In our 2022 Review, we’ll Thanks for…
-
Tour the Refreshed SparkMap Site
Take a tour of the SparkMap website refreshed in January 2023. In this video, useful for new and returning SparkMap Subscribers, we provide some tips of how to navigate SparkMap, highlight new features like topic-based Community Needs Assessments and Maps, and walk through enhanced support materials. We also showcase the new logged in user dashboard…
-
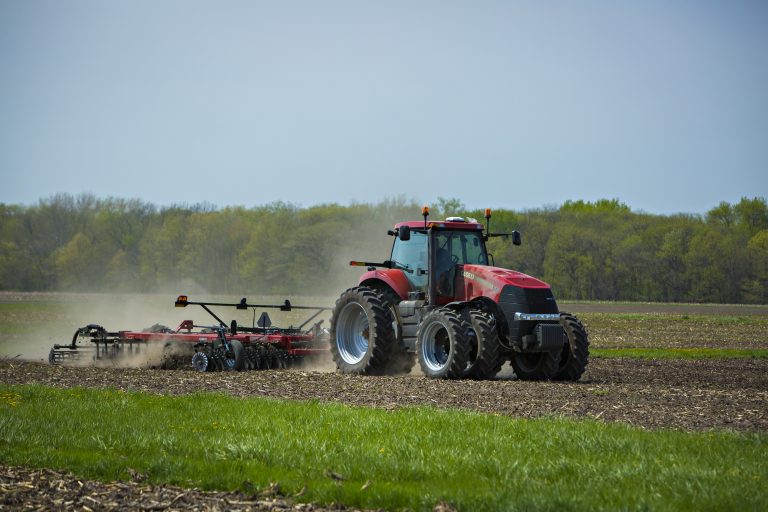
From Farm to Table: Prioritizing Local Food
In our November SparkMap Webinar, we explore locating and purchasing local food. Using cropland, harvest, and farmer’s market data layers, we help you discover the crops grown in your area, what historical harvest levels look like, and where to procure these crops at local farmer’s markets near you. Further, using specialized SparkMap tools, we are…
-
Tracking Data Trends Over Time: Enhancing Data Literacy pt. 3
Focusing on trends in data over time is interesting and impactful. Understanding which job sectors have grown in the last five years, illuminating areas of increased health disparity, or tracking migration patterns within the country are important for community development, resource allocation, and legislative efforts. While it’s easy to assume data from the same sources…
-
Will you survive the Zombie Apocalypse?!
Can you survive the Zombie Apocalypse? Using the Map Room, chart your route to the nearest hospital, supermarket, drug stores, and warehouse stores to ensure you can get supplies. Find out how!
-
Where’s the Food? Part 1: Finding and Using Data on Food Retailer Locations
Whether you work in healthcare, community planning, or community improvement programs access to reliable food is a must. In this blog series we highlight different food layers available on SparkMap and how they can be used to benefit your community.
-
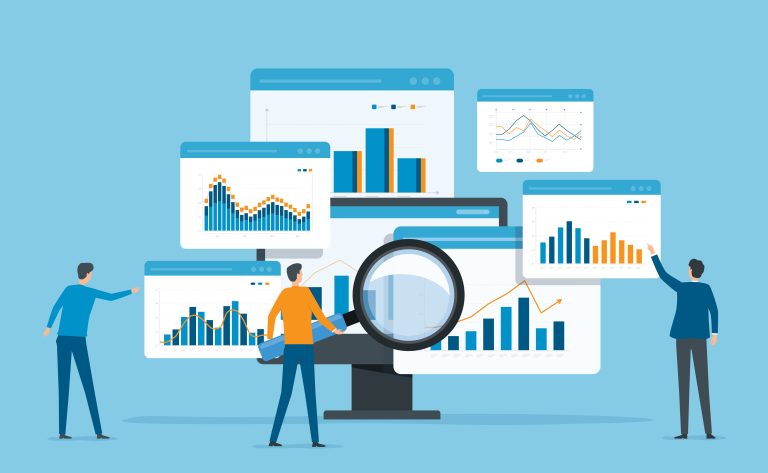
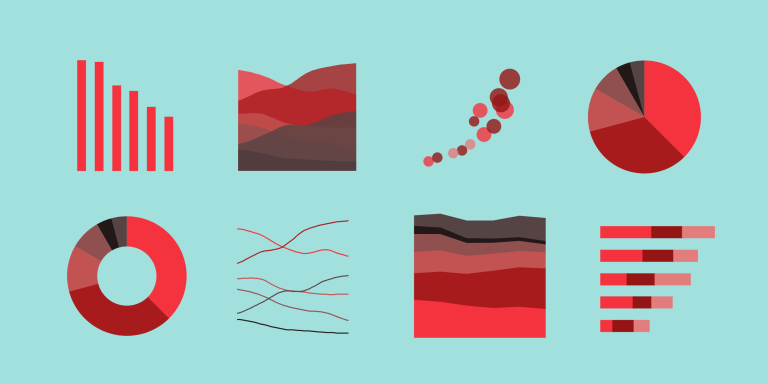
4 Ways to Enhance Your Data Visualizations
In this piece, we consider some of the best practices of data visualization and offer 4 key tips to improve your data viz usage.
-
Public Education Funding and Student Outcomes
The debate around public education funding and student outcomes is longstanding. In this blog, we discuss important background information on where SparkMap’s public education revenue and expenditure data comes from, what it covers, how it is linked to student outcomes over time, and how you can use SparkMap to dive into the link between public education expenditures and outcomes in your community.
-
Enhancing Data Literacy pt. 2: Interpreting Maps
Creating lasting change in your community is only possible when you have an accurate understanding of its strengths and needs. In other words, you need community-level data in order to determine outreach needs, pinpoint service areas, and identify areas in which your community already excels. We believe the best way to do this is through…
-
Data | Environment | Map Room
My World’s on Fire, How ‘Bout Yours?
In this blog, we highlight frequently updated wildfire and drought data layers. Whether or not your community is directly impacted by wildfire season or drought, our climate data can help you stay safe and spur positive community resilience.
-
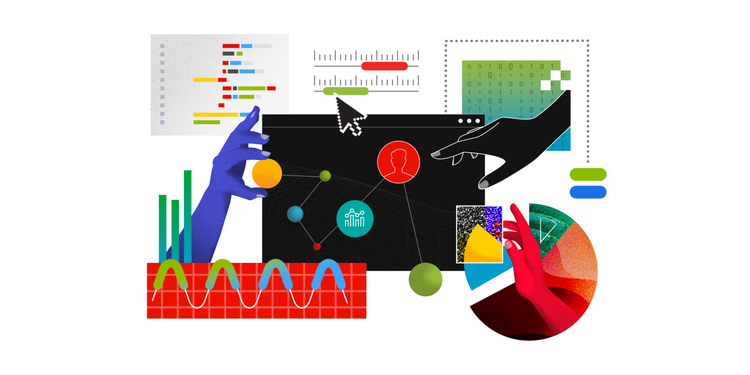
Enhancing Data Literacy with SparkMap
At SparkMap, we’re passionate about impacting communities based on high-quality data. Since you’re here, you probably feel the same way. However, we know that understanding and applying data can be tricky. So, we’re starting a blog series dedicated to the foundations of data literacy. Through this blog series, we hope to empower you by enhancing…
-
The National Commodity Crop Productivity Index (NCCPI)
The NCCPI is a robust and valuable dataset – learn more about it and how to access it on SparkMap.
-
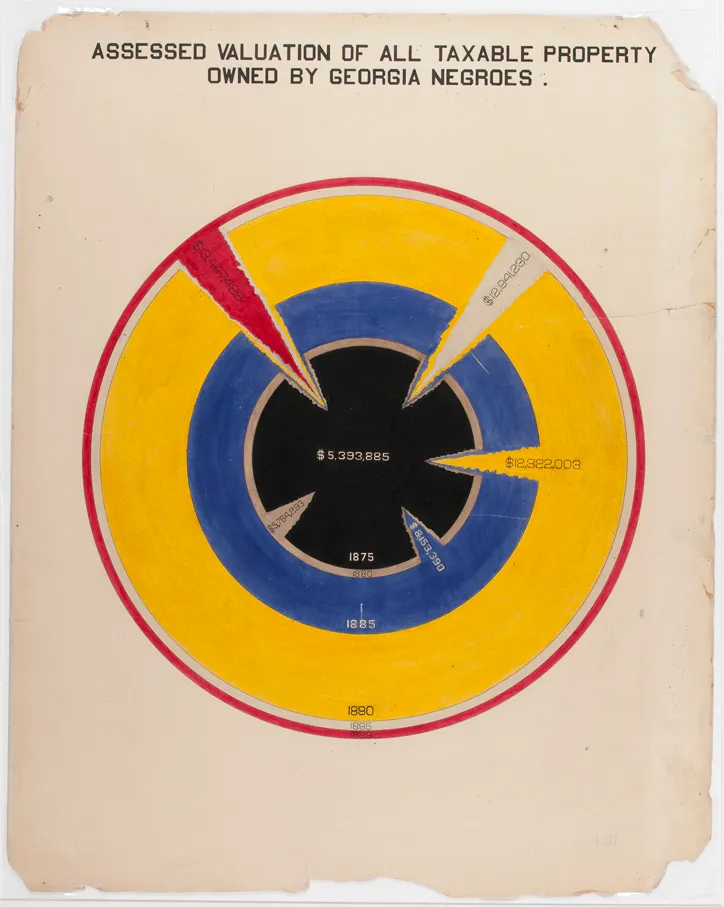
W.E.B. Du Bois & Data Visualization History
In this blog we discuss history of data visualization with a particular focus on the fascinating work of W.E.B. Du Bois.
-
American Community Survey 2016-2020 data has arrived! Here’s what you need to know.
We have updated the American Community Survey (ACS) 5-year estimates on SparkMap! Read more about what the ACS is, what exactly has been updated on SparkMap, and how these changes impact you.
-
The Health, Environmental, and Economic Impacts of Commuting
Commuting to work has significant impacts on personal health, the environment, and the economy. Learn more with SparkMap data in this blog!
-
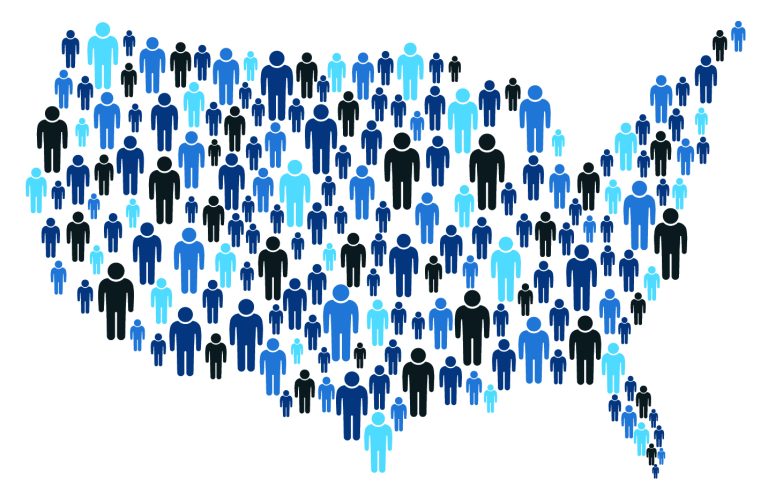
Advancing Demographics: Expanding Race and Ethnicity Measures in the US Census
The US Census Bureau has changed demographic questions in response to a changing country. Read more about how these changes reflect increased diversity of Americans, why these modifications matter.
-
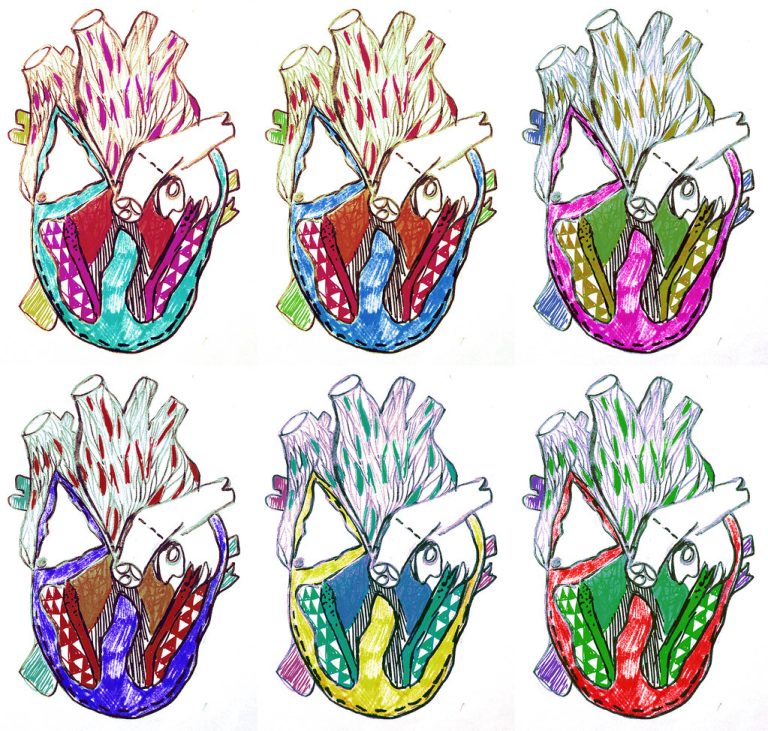
Heart Disease – Designing Community Interventions
Heart disease is the leading cause of death in the United States. How can we use maps and data to understand where our most at-risk communities are and what interventions may help?
-
Building a Multi-Layer Map: Part One
In this blog series, “Building a Multi-Layer Map” we will explore answers to core map-making questions, unpack some best practices, and highlight how you can use SparkMap to tell a story, rooted in data, about your community.
-
A Year in Review: Looking Back & Gazing Ahead
In this blog we take a look back at all that you accomplished in 2021 and preview what’s to come in 2022. Thank you for being part of SparkMap. We can’t wait to see what you create this year!
-
Hyperlocal data in the Map Room – looking for Nonprofits near me
Learn how to use the Select Data tool in the Map Room to see data in context of a specific region or distance from a point. In this example, we’ll look at the data for 501(c)(3)s and (c)(4)s that are within 1 mile of an address.
-
Community Assessment 101
Our Community Assessment tool provides those in healthcare, non-profit, and local governments with the data they need to make reports highlighting community needs and areas for improvement. Let’s create a Community Assessment in 6 easy steps!
-
Diabetes: Assessing Risk Amidst the Pandemic
People with Type 1 and Type 2 diabetes are more likely to develop serious cases of COVID-19, including hospitalization, than those who don’t have diabetes. But, how can healthcare providers identify those with diabetes and determine strategies to support them? SparkMap can help!
-
Map Room 101
Use the Map Room to tell the story of your community in a compelling and visually interesting way. Learn how to add data to a map and explore some basic ways to understand that data.
-
Choosing the Right SparkMap Product for You
What brought you to SparkMap? Was it our mission to bring you all the data you need, ready to go, all in one place? Was it the 279 indicators you can use to create Community Assessments? Or, perhaps you were interested in using our Map Room to tell the story of your community through some…
-
New Census 2020 Redistricting Data Available!
On August 12, the U.S. Census Bureau released the most comprehensive set of data yet from the 2020 census. Demographic data was released at the “census block” level, which is the smallest unit of geography the census defines for public use (see below resource for more information) .
-
COVID-19 in Your Community: Get the Latest Data
As we witness COVID-19 variants sweep through the country, we recognize that data for decision-making is more important now than ever. Learn more about what’s happening in your world with data around COVID-19 Vulnerability, Vaccinations, and Hospitalizations.
-
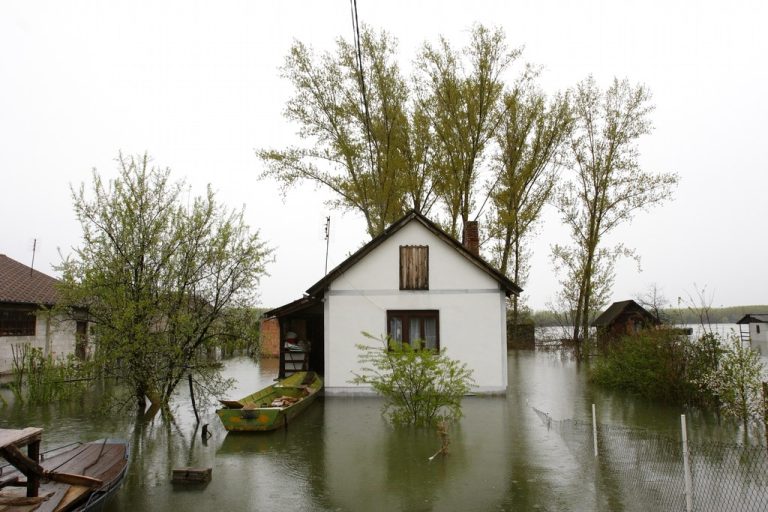
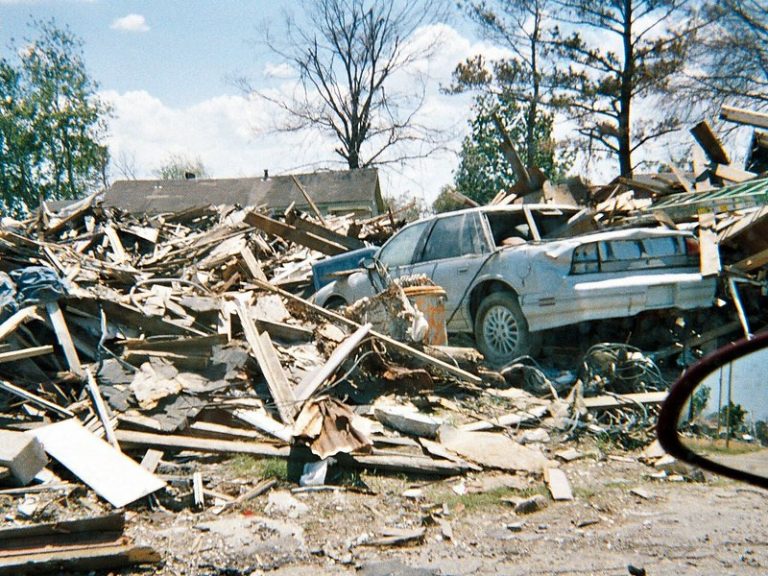
FEMA National Risk Index
What are the riskiest disasters that communities should be prepared for and where should resources be allocated? The Federal Emergency Management Agency (FEMA) released a new index – the National Risk Index – to help communities mitigate disasters with more specificity.
-
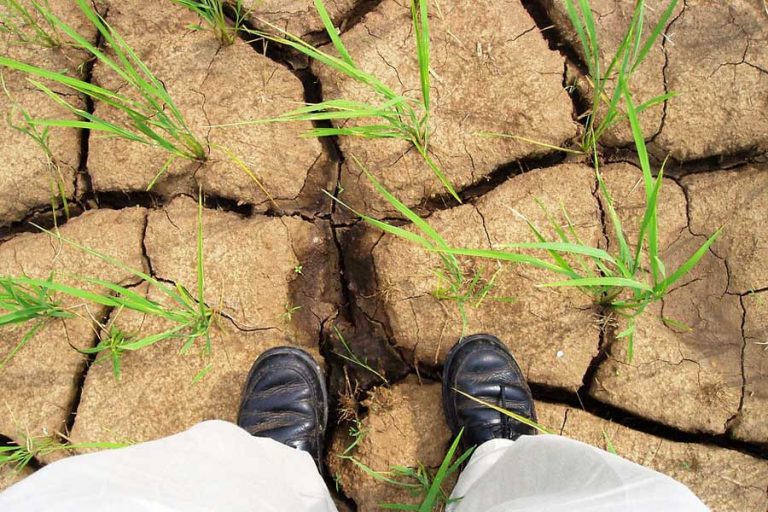
U.S. Drought Monitor (or, It’s a Dry Heat)
One of our frequently updated datasets, Drought Intensity from the U.S. Drought Monitor, is unfortunately coming into greater use as drought conditions intensify across the United States. Learn more about the dataset and it’s uses.
-
Environmental Data and Park Access
Research, and personal experience for many, has shown the positive relationship between time outdoors and our physical and mental health. Learn how to use the Map Room to access environmental data and make the case for parks in your community.
-
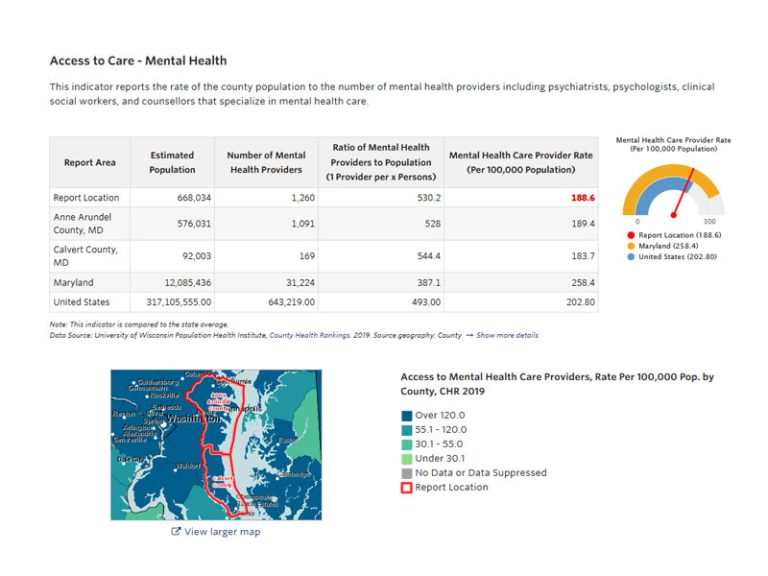
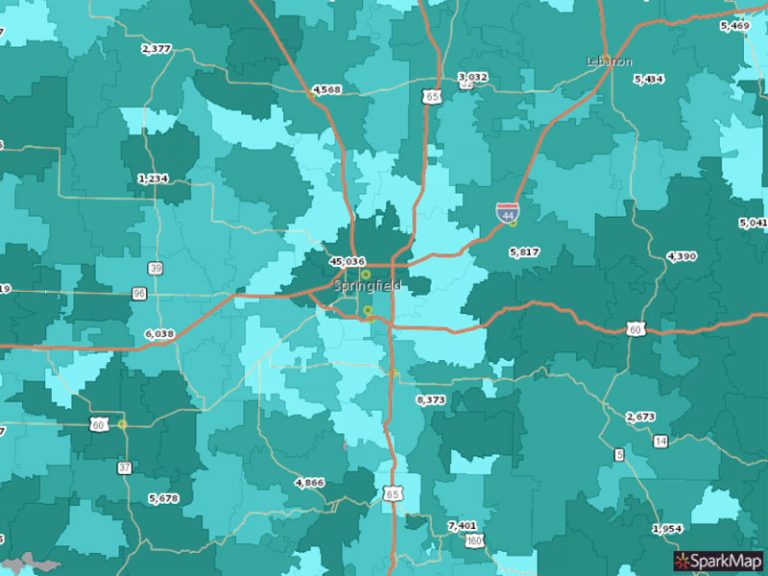
Understanding Access to Mental Health Resources
In order to maintain positive, long-term mental health outcomes in communities around the nation, organizations and governments need access to up-to-date, reliable, and accurate data to effectively allocate resources, programs, and training opportunities for those who need it most. Read this blog to learn how to use SparkMap tools and resources to build a case for funding.
-
The American Rescue Plan Act
With a relatively sudden influx of federal dollars for communities to allocate, it will be crucial for decision makers to use relevant and reliable data to make informed decisions. SparkMap’s data and analysis platform is a crucial resource for helping local governments identify the needs of their communities.
-
ZIP Code Data Now Available in the SparkMap Assessment
For the first time ever, SparkMap is offering ZIP code breakouts for nearly 100 of our indicators. Get data for every ZIP code in your assessment area – view alongside our dynamic data visualizations or download for offline use.
-
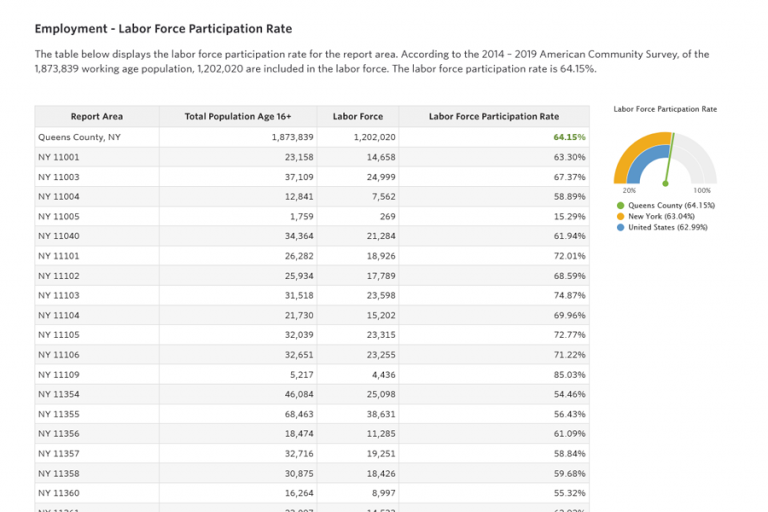
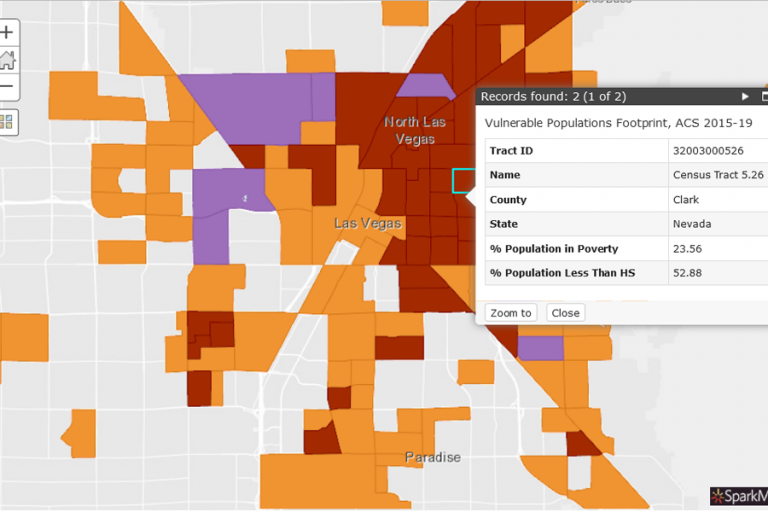
Explore the intersection of poverty and education: SparkMap’s Vulnerable Populations Footprint Tool
Identify Vulnerable Populations with the SparkMap VPF Tool and help change health outcomes in the communities you care about.
-
COVID-19 Spread and Long-Term Consequences
COVID-19 has severely affected the economy, health, and mental well-being of every community around the United States. SparkMap provides real-time data sharing, analysis, and visualization—key strategies for an equitable and speedy recovery. This blog shows how our map and assessment tools are used to understand COVID-19 cases and its consequences.
-
To Avoid Gender Bias, We Need Sex-Segregated Data
Are you focused on expanding, understanding, or analyzing women’s opportunities in the economic sector, do you want to support the implementation of gender-focus policies in the US or at the local level? Learn about how you can access sex-aggregated data on this week’s blog in honor of Women’s History Month.
-
BRFSS Demystified
If you’ve existed in the health space for any period of time, you’ve probably heard of BRFSS data, but what is it, really?
Learn more about the importance of the Behavioral Risk Factor Surveillance System.
-
Announcing the SparkMap Blog!
Welcome knowledge-seekers, problem solvers, and changemakers!