Digging Deeper into the NCCPI 3.0
The National Commodity Crop Productivity Index 3.0 (referred to as “NCCPI” for the remainder of this blog) is an invaluable tool for assessing soil productivity potential in the United States. This blog serves as a companion piece to an earlier blog post providing introductory information to the NCCPI on SparkMap. Here, we’ll dig in a little bit deeper to cover:
- Development of the NCCPI
- Reasons to Use the NCCPI
- Interpreting the NCCPI
The Development of the NCCPI
Historically, states developed their own crop production models to provide estimates for state-wide soil productivity. For example, the Iowa Corn Suitability Rating evaluates different soils in Iowa for potential row-crop (i.e., a crop planted in rows like corn or cotton) productivity based on soil profiles, weather conditions, and slope factors.1 This provides important information for those in Iowa, but the problem with state-specific crop production models are that they cannot be compared or applied to different regions of the United States.
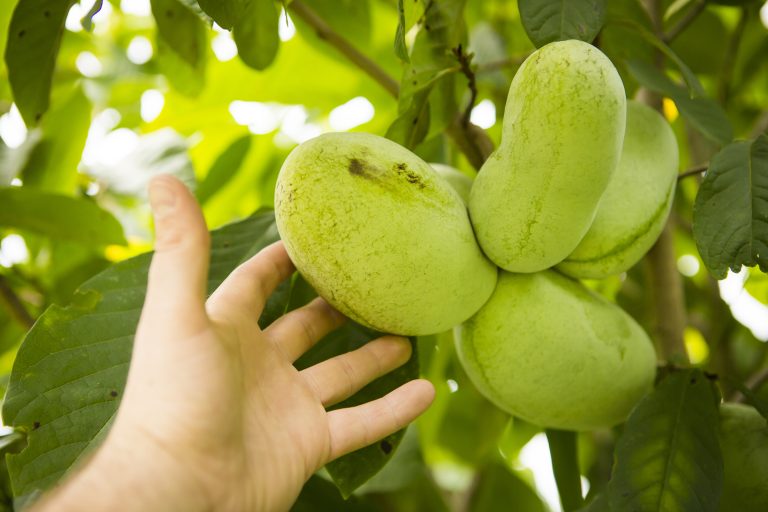
To address this challenge, the NCCPI was developed by staff at National Soil Survey Center in Lincoln, NE to provide a national index assessing the capacity of a soil to inherently produce commodity crops without irrigation.2 Essentially, this index estimates how productive an area of land could be in growing soybeans, cotton, corn, or small grains without being irrigated based on the type of soil (and other factors). As such, the NCCPI is not intended to replace state-specific models, but rather to provide an additional index that remains consistent across state lines, time, and political boundaries.
Reasons to Use the NCCPI (with some caveats)
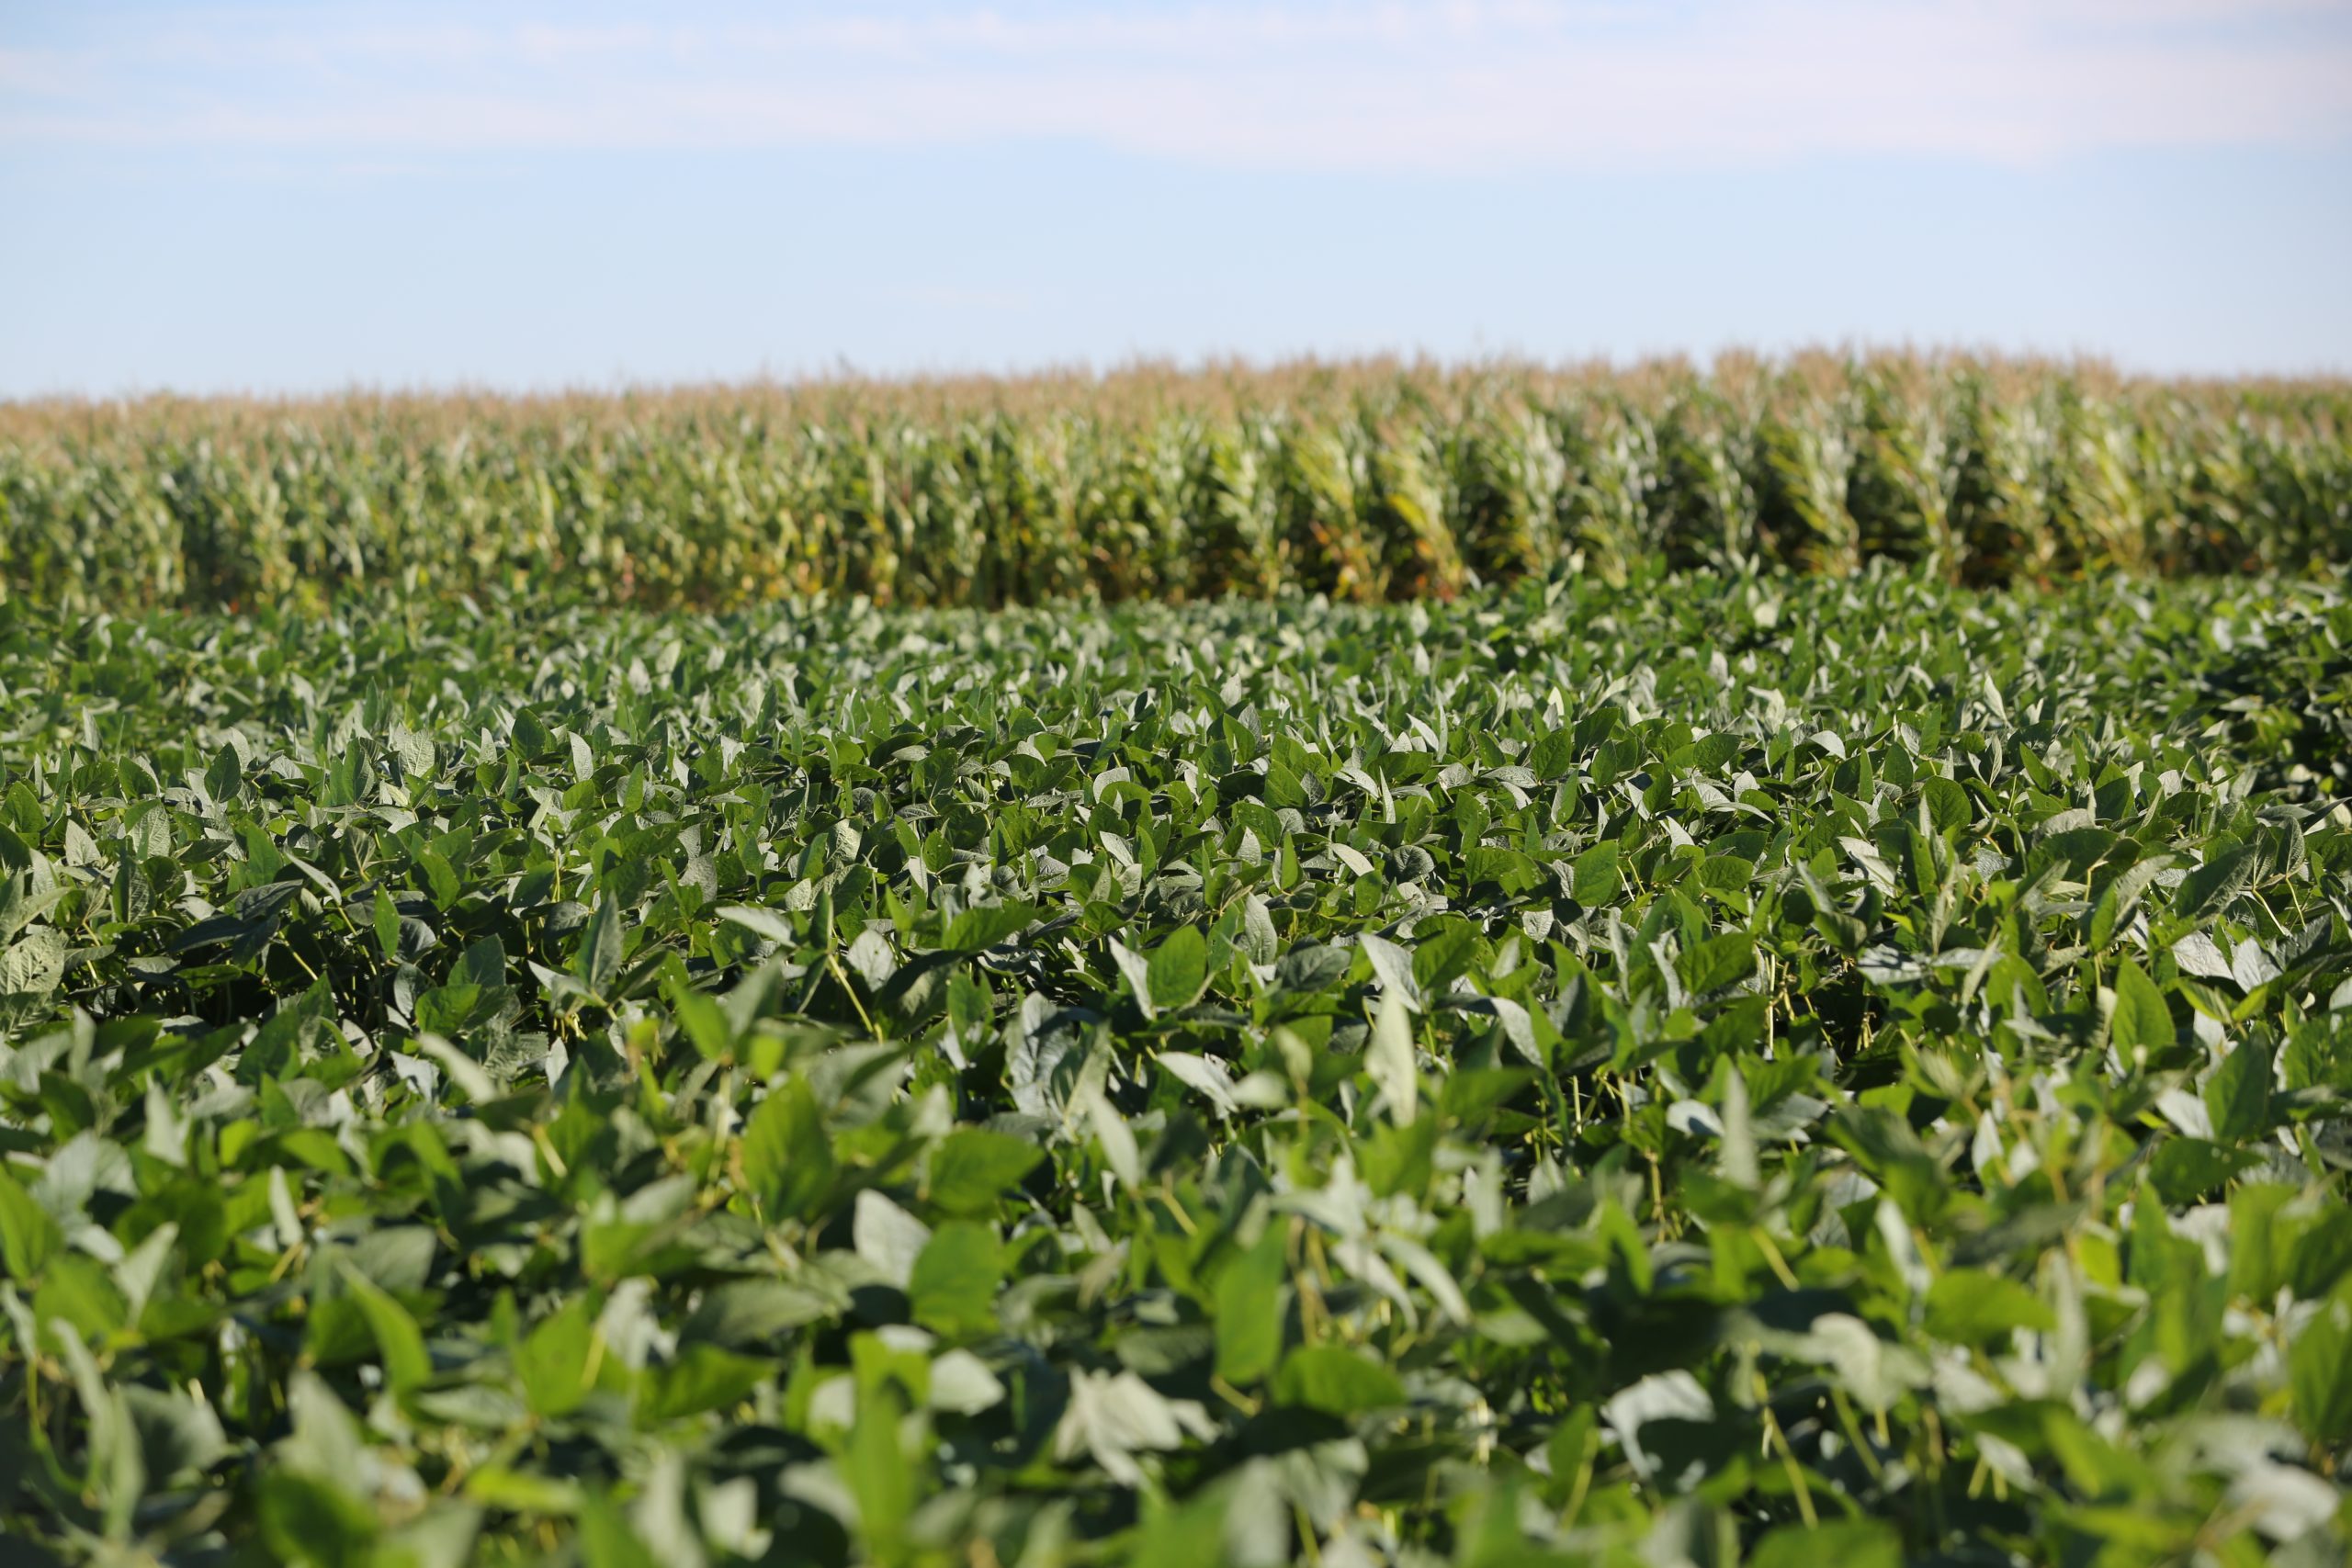
Aside from being a national index, one of the main reasons to use the NCCPI is because it models the four crops mentioned above. This is advantageous, as these crops thrive in different soil types, geographic regions, and climates. The index provides information for individuals to compare crop productivity in different soils. For deeper insight on factors the NCCPI considers when measuring soil performance, check out our companion blog.
An additional reason to use the NCCPI is that it gives inherent productivity of soil over a period of years, rather than estimated crop yields in a single year. Earlier crop productivity models provided estimates of crop yield, such as bushels of corn one could expect from a piece of land.1 The problem with yield estimates, however, is that they may change drastically from year to year based on crop variety, land topography, climate, land management, and other factors. Soil productivity on inherent properties of the soil, on the other hand, is more reliable and consistent throughout time. Thus, soil productivity estimated by the NCCPI today is not expected to be drastically different next year, in five years, or even a decade from now.
These are strong reasons for making the NCCPI a standard part of land valuation and management—and it is. However, it’s important to consider a few caveats. First, the index is not meant to replace state-specific models. It can be used to provide additional information but should be used along state-specific resources. Second, the NCCPI is a great starting point for information on a particular piece of land, but it does not replace ground level experience. The information provided by the index should be used as a guide, not the sole source of information for planting, purchasing, or land valuation decisions. Lastly, the NCCPI does not take into account how a piece of land has been managed.3 Current or previous landowners may make decisions that alter the inherent capability of soil to be productive—yet this information is not included in the index. Despite these caveats, the NCCPI is an informative and helpful index when assessing non-irrigated crop productivity around the nation.
Interpreting the NCCPI
Depending on where you access the index, the NCCPI rating can be found either on a scale of 1-100, or 0.01-1. Either way, these scores can be understood in the same way: higher numbers represent higher productivity. On SparkMap, we display NCCPI ratings on a 0.01-1 scale, as described by the Natural Resources Conservation Service. On this scale, the closer a soil’s rating is to 1, the more inherently productive it is expected to be. For the remainder of the blog, follow along with this interactive map as we interpret NCCPI ratings in the SparkMap Map Room. For more detail on loading NCCPI layers in the Map Room, see our previous blog post.
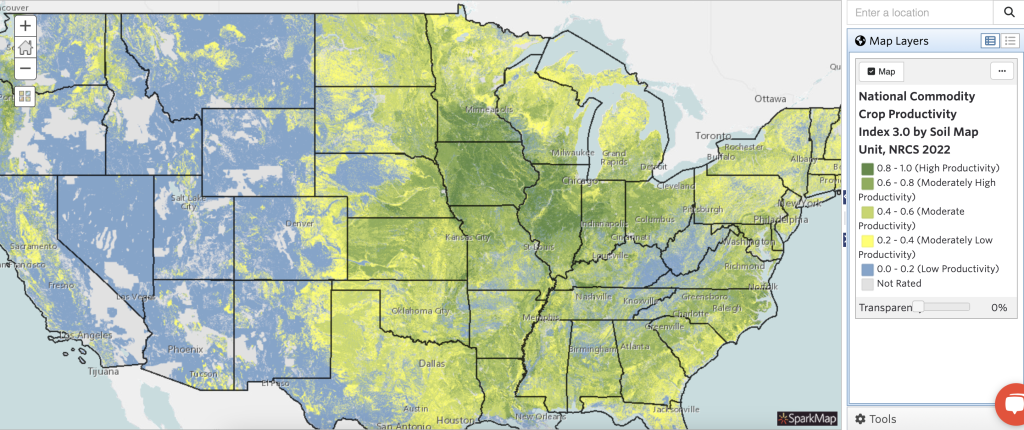
As soon as you add the NCCPI layer to your map, it’s easy to see some general trends. By looking at the map legend on the right, we’re able to see areas in the Midwest, South, and along the East Coast tend to be more productive than areas on the west side of the country (Figure 1).
By zooming in, we’re able to see more variability in soil productivity in different parts of a state. Further, when we click on the map, we are presented with information about the soil type, maximum productivity index, crop on which this maximum productivity score is based, and how many acres of land to which this report pertains (Figure 2). By pressing the “Zoom to” button, you’re able to zoom right into the parcel of land you for which you received the index rating.
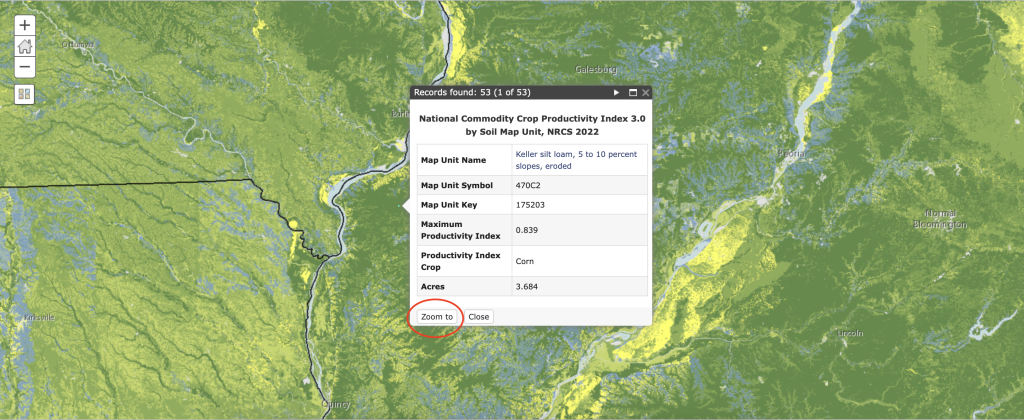
As noted above, you will only see the maximum productivity index for a single crop when clicking on the map. This is because the appropriate way to use the NCCPI is to record the score of the crop which is estimated to be the most productive. Again, crop productivity depends on soil, region, climate, and many other factors which is why the NCCPI includes ratings for multiple commodity crops.
Conclusion
Overall, the NCCPI is a helpful tool for gaining information about how inherently productive soil on a certain piece of land may be. This index was developed to provide a standard national tool to evaluate soil productivity: scores closer to 1 indicate higher estimated productivity. However, it is important to use the index along with state-specific models and experienced stakeholders on the ground to get a full scope of soil productivity.