Enhancing Data Literacy with SparkMap
At SparkMap, we’re passionate about impacting communities based on high-quality data. Since you’re here, you probably feel the same way. However, we know that understanding and applying data can be tricky. So, we’re starting a blog series dedicated to the foundations of data literacy. Through this blog series, we hope to empower you by enhancing your data literacy capabilities and, in turn, help you use data to enhance community impact.
In this installment, we will cover:
- What is data literacy?
- Why is data literacy important?
- What key terms should I know to understand and apply SparkMap data?
What is data literacy?
Data literacy has become somewhat of a buzzword, but what is it really? Data literacy is the ability to find, comprehend, summarize, and present data-based information.1 It can involve both conducting research to gather data yourself (i.e., primary data) or accessing and synthesizing data gathered by another person or organization (i.e., secondary data).
The first step to building data literacy is gaining access to data. Luckily, you already have that covered with your SparkMap subscription. The second step towards building data literacy is understanding data. That’s what we’ll cover here. The final step is applying critical thinking to interpret and make data-based arguments. We’ll be dissecting step three throughout the remainder of this blog series.
Why is data literacy important?
We are living in an increasingly data-driven world. No longer is data reserved for statisticians and academics. Rather, data is becoming part of our everyday conversations, especially as the COVID-19 pandemic introduced regular data visualization and discussion to mainstream media.2 It is now expected that policies, proposals, and presentations include data analysis and visualization. Thus, enhanced data literacy has become an essential tool for navigating discussions, plan-making, and problem solving in the workplace. Further, it is necessary to understand and apply your data accurately and ethically to drive the most effective community change.
What key terms should I know to understand and apply SparkMap data?
To navigate data in the SparkMap Map Room and Assessment, you need to be familiar with three main categories of vocabulary: SparkMap lingo, data types, and source geographies.
SparkMap Lingo
Here at SparkMap, we refer to both layers and indicators. What’s the difference? We use layers in the Map Room. They’re the layers you add on top of the map. Indicators, on the other hand, refer to the data available in our Assessment–they indicate information. Oftentimes, the layers in the Map Room and indicators in the Assessment represent the same secondary data set and are just presented in different ways.
Another term you’ll see around SparkMap and other sites is data source. The data source simply refers to the group or organization responsible for collecting the data. Some examples of secondary data sources you’ll find on SparkMap, include the CDC, US Census Bureau, and other organizations. Oftentimes, you’ll see that we have multiple data layers and indicators available from a single source.
Data Type
Data type refers to how the data are counted or calculated. Common data types you’ll see on SparkMap include rate, percent, and total. Rates and percentages, for example, are calculated by dividing the counted number by the total number (e.g., percent of male population is the number of males counted divided by the total population of people). On the other hand, total is a count. Identifying and understanding data type is essential for determining the quantities represented in a data set and how it can be interpreted.
Percent will tell you the percent of population, respondents, organizations, etc. that meet a certain criterion. Total will tell you the total number of individuals, organizations, etc. that meet the criterion. Lastly, rate is normalized data that will tell you how many people, businesses, etc. meet your criterion compared to a standard.
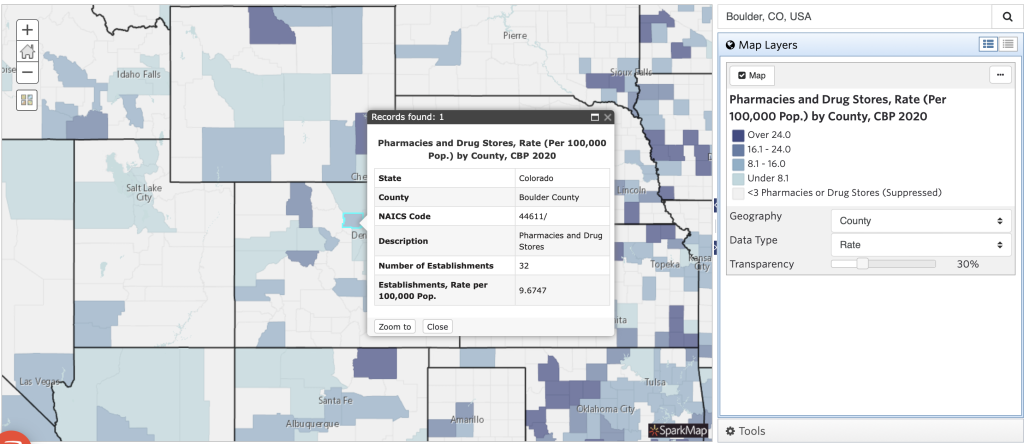
As an example, data formatted as rate would tell you that there are 9.67 pharmacies and drug stores for every 100,000 people in Boulder County, Colorado as exemplified in Figure 3. On the other hand, total type data would tell you there are 32 total pharmacies and drug stores in Boulder County. Data type is important because it influences the claims you can make about the data. We’ll discuss this more throughout this blog series.
Source Geography
Source geography refers to the geographical boundaries to which data applies. Data can be collected at many levels, such as state, county, place, tract, and ZCTA. Place generally refers to data presented at the city level, tract refers to data presented at the Census tract level which is a subset of counties, and ZCTA refers to an areal representation of ZIP codes based on US Postal Service delivery routes. You’ll see an example of data at the county geography above in Figure 3. We recommend viewing the US Census’ Bureau’s Glossary as one reference for an in-depth explanation of different source geographies.
Understanding SparkMap lingo, data type, and source geography are critical to interpreting our maps and assessments. This is just the beginning of data literacy.
References
- Prado, J. C., & Marzal, M. A. (2013). Incorporating data literacy into information literacy programs: Core competencies and contents. Libri: International Journal of Libraries and Information Services, 63(2), 123-134. doi:10.1515/libri-2013-0010
- Bather, J. R., Dias, J. J., & Goodman, M. S. (2022). The demand for literacy training on quantitative public health data. Amstat News. https://magazine.amstat.org/blog/2022/02/01/public-health-literacy/