How to Use the Draw Graphics Tool
The Draw Graphics Tool allows you to draw points, lines, and polygons on the surface of your map. Your markups remain visible when you download or share your map, making it easy to highlight specific information for presentations. This tool is available for all SparkMap users.
Draw Your Shape
Edit Your Shape
Save & Share Your Edited Map
Step 1 – Draw Your Shape
To find the Draw Graphics Tool, click the “Tools” tab in the left menu and select Draw Graphics from the tools list.

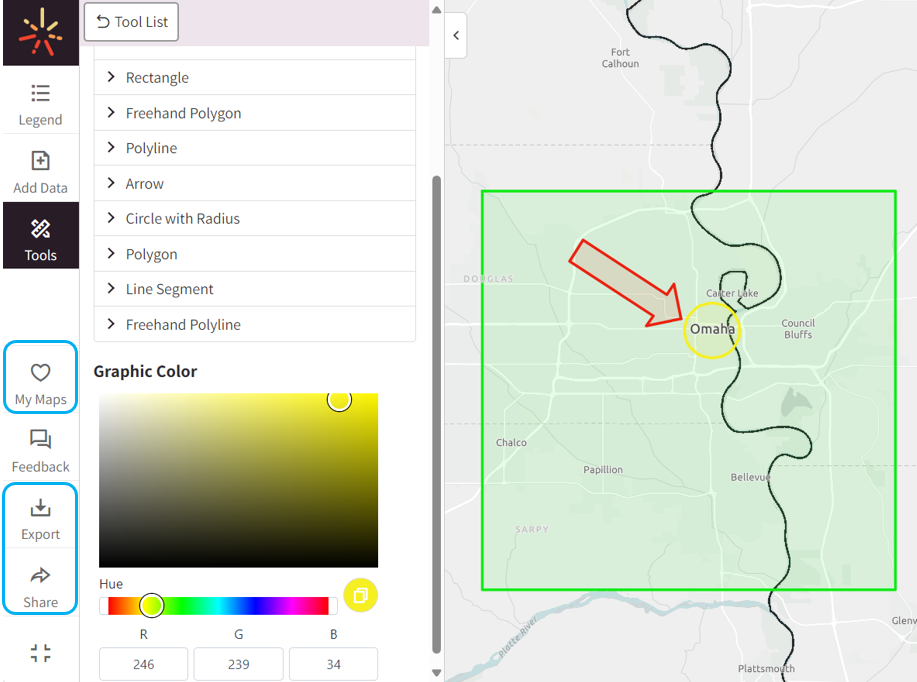
A list of graphic types will populate (Figure 2). Click to select your graphic of choice.
Once you select your graphic type, instructions on how to draw it will appear.

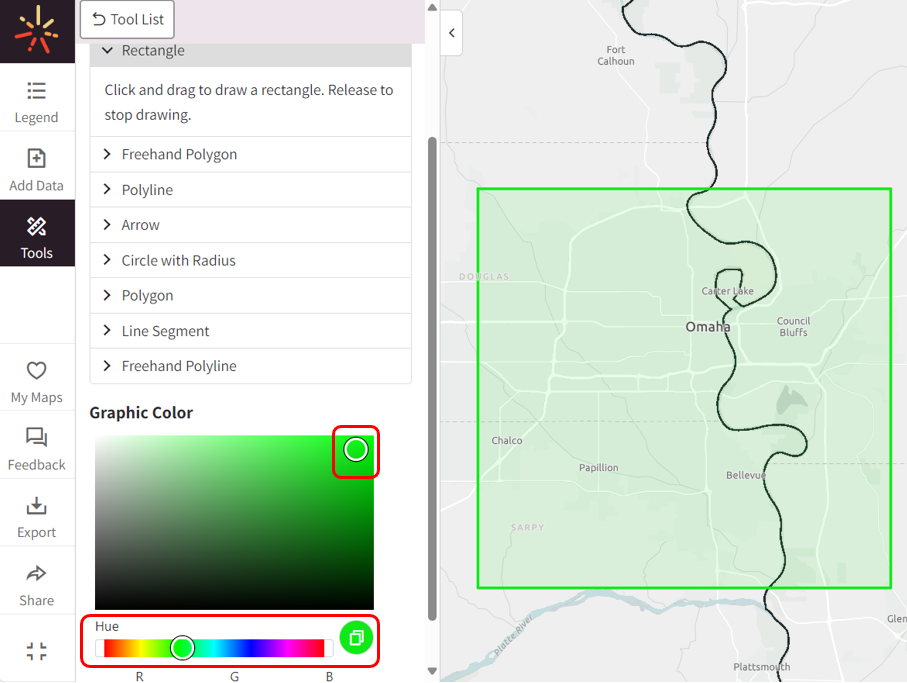
To select a color for your graphic, use the color hue slider and select a color from the graphic color box. (Figure 3).
Once you are ready, use the tool’s instructions to draw your shape onto your map
Step 2 – Edit Your Shape
To remove the last graphic added to the map, select the Back Arrow button (Figure 4, circled in red). You can also discard all drawings by selecting the Eraser button. (Figure 4, circled in blue).

Once you are satisfied with your edited map, remember to save it to your SparkMap profile. The save option can be found by clicking the “My Maps” tab in the Map Room menu. You can also share and download your results by clicking the “Share” and “Export” tabs. (Figure 5, circled in blue).