My World’s on Fire, How ‘Bout Yours?
Did you know that across the United States warmer, drier climates are contributing to longer and more damaging wildfire seasons?1 At the writing of this blog, wildfires are raging in Yellowstone National Park, throughout Alaska, and within the Southwest United States. We can expect continued fire activity through October at rates far exceeding 10-year averages.2 Wildfire season is dangerous, and this danger is exacerbated by increasing temperatures, drought, and other changing climate conditions. On SparkMap, we have several resources to help you stay alert during wildfire season and look deeper into compounding factors. Whether or not your community is directly impacted by wildfire season, our data on fires, drought, snowfall, and temperature are powerful resources that can help you stay safe and spur positive community impact.
In this blog, we’ll cover:
- Background on Live Wildfires Data
- Background on US Drought Monitor
- Applying Wildfires and Drought Data Layers for Community Resilience
Background on Live Wildfires Data
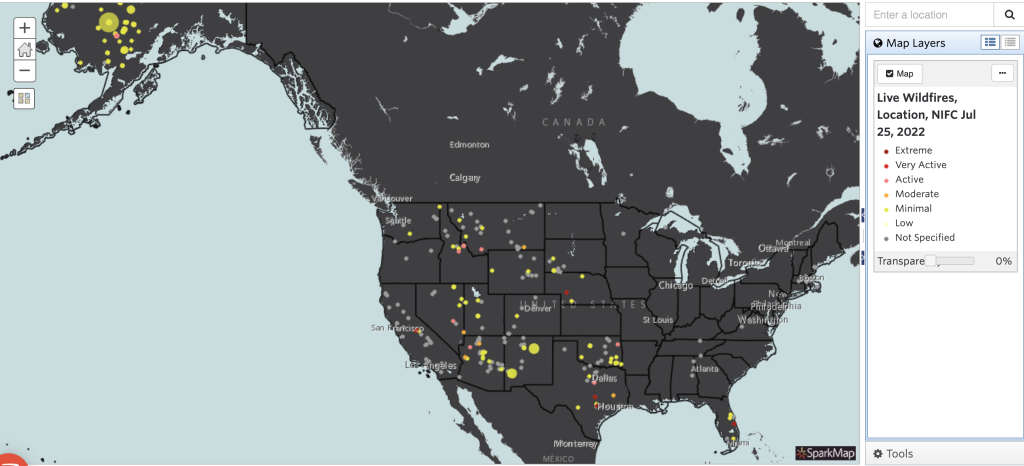
The Live Wildfires Data layer on SparkMap is sourced from the National Interagency Fire Center (NIFC). The NIFC is the nation’s premier support center for wildland firefighting and policy making, composed of eight emergency response organizations and agencies.3 Therefore, the Live Wildfires Data layer comes from the leading experts on US wildfire behavior. On SparkMap, this layer is updated daily, giving you access to the timeliest information.
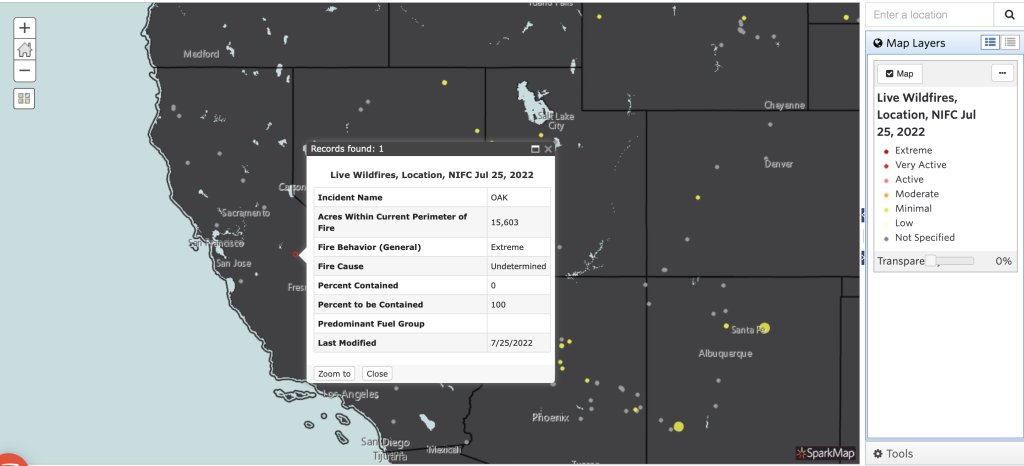
When you add the Live Wildfires Data Layer in the Map Room, you’ll see all active wildfire locations around the country (Figure 1). Further, when you click on a fire, the incident name, number of acres within the current perimeter, fire behavior, fire cause, and percent of the fire contained will appear (Figure 2). This is extremely vital information for those working in emergency management, as well as those living in wildfire areas.
Background on US Drought Monitor
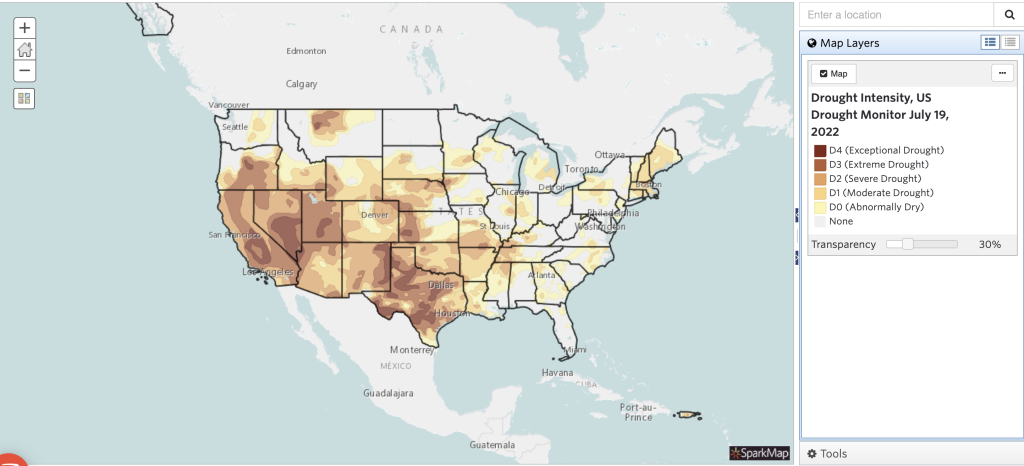
Although wildfires can occur spontaneously, environmental factors like drought may make an area more at risk. Drought Intensity from the U.S. Drought Monitor (USDM) is another data layer on SparkMap updated on a weekly basis. This layer is updated and released weekly through a partnership between the National Drought Mitigation Center at the University of Nebraska-Lincoln, the United States Department of Agriculture, and the National Oceanic and Atmospheric Administration.4 The purpose of the USDM is to classify areas of the US as abnormally dry (D0; indicating approaching or coming out of a drought), or in a moderate (D1), severe (D2), extreme (D3), or exceptional (D4) drought (Figure 3).5 The USDM is used for a variety of purposes, including deciding eligibility for low-interest loans, determining Livestock Forage Program participants, adjusting taxation on livestock, and forming multilevel drought response. For additional information on the US Drought Monitor, check out our previous blog.
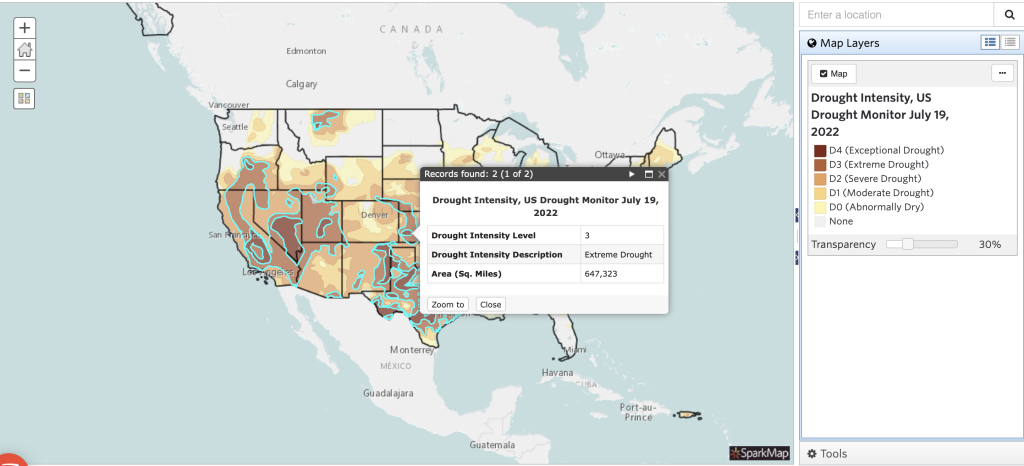
As indicated above, this layer is important because it provides a weekly update on drought conditions throughout the nation. By clicking on a specific area of the map, you will be presented with the level of drought intensity for that area, as well as the number of square acres around the country at the same level of drought intensity (Figure 4). This layer is significant, as drought affects water supply, domestic energy, community health, wildlife, agriculture, and more.
Applying Wildfires and Drought Layers for Community Resilience
The Live Wildfire Data and US Drought Monitor layers were chosen as the focus of this blog for a couple of reasons. First, they are some of our most frequently updated climate layers, keeping our promise to deliver timely and accurate data. Second, wildfires and drought tend to co-occur, making it most impactful to your communities to examine them together.6
If your community is vulnerable to both wildfires and drought, what can you do? According to the National Integrated Drought Information System, in such areas, it is helpful to thin trees and vegetation, engage in prescribed burning, and let fires burn if they do not impact people.6 Further, individuals should create an area around their property free from vegetation, debris, or other types of wildfire fuel to help reduce spread.
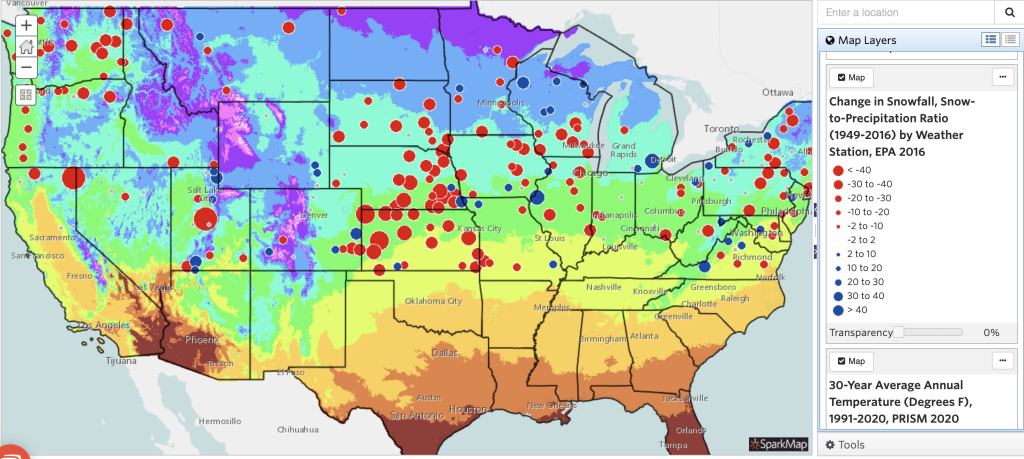
On SparkMap, you can also compare related map layers, to better understand your communities’ vulnerabilities to wildfires. Other factors that influence wildfires include change in snowfall data and average temperatures data. Adding these layers to your map help to illuminate important trends (Figure 5). Areas exemplifying decreased snowfall and/or increased temperature trends are even more at risk of developing large scale wildfires.
By familiarizing yourself with the various climate related layers in SparkMap, you’re able to assess wildfire vulnerability in your community and begin creating a plan for response and resilience.
References
- https://www.c2es.org/content/wildfires-and-climate-change/
- https://www.predictiveservices.nifc.gov/outlooks/monthly_seasonal_outlook.pdf
- https://www.nifc.gov/about-us/what-is-nifc
- https://droughtmonitor.unl.edu/About/AbouttheData/DroughtClassification.aspx
- https://droughtmonitor.unl.edu/About/WhatistheUSDM.aspx
- https://www.drought.gov/sectors/wildfire-management