Decoding Commuting Distance Patterns
Introduction
Commuting has important implications for our health, environment, and economy as discussed in a previous blog post. To follow up on the previous piece, this post further explores commuting patterns by taking a closer look at commuting distances. We will highlight some new analyses and modeling done on publicly available commuting data to learn how far people in census tracts are commuting and to explore tracts where commuting distance modeling shows unexpected results. We will start with an overview of our commuting distance calculation as well as a new predictive model based on demographic and workplace area characteristics. You will learn about commuting distances in your community – with results that may surprise you.
The Data
After incorporating some data from the Census Longitudinal Employer-Household Dynamics (LEHD) into the SparkMap Map Room, we expanded our analysis to see just how far people are commuting to work. The LEHD Origin-Destination (OD) dataset provides home census blocks and work census blocks11 and the number of commuters that go between the two for all participating states. We calculated the straight-line distance between the center of the census block where a person lives and where they work. To calculate the mean distance commuters traveled in a census tract, we dropped any distances over 125 miles, as we deemed them unrealistic commute distances and averaged the remaining commuter distances . You can explore the resulting commuting distance map layer in SparkMap and see what commutes are like in your community.
Looking at these calculations and the resulting map, some discrepancies in some of the distance calculations were striking. For example, why did a particular census tract have an average commute of 12 miles and the one next to it averaged 18 miles? To answer this question, we decided to explore how more data might provide insight to these differences.
Predicting Commuting Distance
We used a Machine Learning method called Random Forest to create a model to predict the average commuting distance of residents of a census tract based on various characteristics that we will detail below. This machine learning method uses subsets of the input variables to create decision trees. It then combines these trees and ‘votes’ on a prediction to increase the accuracy of the overall model. The model was trained on data for census tracts containing more than 20 residential commuters for which there was data and excluded commuting distances of over 150 miles as these were deemed as unrealistic for everyday commuting. The data also excludes the states of Alaska, Arkansas, and Mississippi which did not participate in the LEHD program. The model was then trained on 80% of the census tracts and tested on the remaining 20% to ensure that the model worked as well on data it was not trained on as the data it was trained on.
Which Variables were used?
One advantage of machine learning methods like Random Forest is that they perform well with many input variables. We used many variables to fit our model, most coming from the LEHD OD and Workplace Area Characteristics (WAC) datasets (see list below). In addition, we used the metro/non-metro designation and land area of each county as variables, as we thought these could have major impacts on how far people commute. We used the following variables as input:
- Tract is in a county considered Metro as of 2020
- Percent of Commuters who Reside in Census Tract that work in Good Producing industry
- Percent of Commuters who Reside in Census Tract that work in All Other Service industry
- Percent of Jobs Available in the Census Tract in Agriculture, Forestry, Fishing, and Hunting
- Percent of Commuters who Reside in Census Tract Aged 55+
- Percent of Commuters who Reside in Census Tract Earning between $1251-$3333/Month
- Percent of Commuters who Reside in Census Tract Earning $3333+/Month
- Percent of Commuters who Reside in Census Tract Aged Under 30
- Percent of Commuters who Reside in Census Tract Aged 30 – 54
- Square Miles of the County
- Percent of Jobs Available in the County in Public Administration
- Percent of Commuters who Reside in County that work in Trade, Transportation, and Utilities industry
- Percent of Commuters who Reside in County Earning Under $1250/Month
- Percent of Jobs Available in the County in Health Care and Social Assistance
- Percent of Jobs Available in the County in Professional, Scientific, and Technical Services
- Percent of Jobs Available in the County in Other Services (Except Public Administration)
- Percent of Jobs Available in the County in Accommodation and Food Services
- Percent of Jobs Available in the County in Construction
- Percent of Jobs Available in the County in Administrative and Support and Waste Management and Remediation Services
- Percent of Jobs Available in the County in Retail Trade
- Percent of Jobs Available in the County in Wholesale Trade
- Percent of Jobs Available in the County in Educational Services
- Percent of Jobs Available in the County in Utilities
- Percent of Jobs Available in the County in Manufacturing
- Percent of Jobs Available in the County in Finance and Insurance
- Percent of Jobs Available in the County in Transportation and Warehousing
- Percent of Jobs Available in the County in Real Estate and Rental and Leasing
- Percent of Jobs Available in the County in Arts, Entertainment and Recreation
- Percent of Jobs Available in the County in Information
- Percent of Jobs Available in the County in Mining, Quarrying, and Oil and Gas Extraction
- Percent of Jobs Available in the County in Management of Companies and Enterprises
Commuting Distance Results
After training the data, we then tested the model on the data not used for training, which had an R-squared value of 0.79, meaning about 79% of the time the model accurately predicts the mean commuting distance for a given census tract (on data it had never seen!). The Mean Absolute Error for the model was 2.2, meaning on average each tract’s predicted value was 2 miles off from the mean commuting distance calculated from the original data. With such good results from the test, we applied the model to all census tracts in the country (outside of the states mentioned above) to find a predicted average commute distance for each census tract. We then wanted to find those tracts where the actual commuting distances as calculated from the OD dataset varied from the average distances predicted by the model.
In total, we found 64,074 census tracts (110,387,396 commuters) had a predicted average commute distance within 10% of the actual average commute values using our model. Therefore, people were commuting about what the model predicted. 10,311 tracts (15,573,182 commuters) had a lower-than-expected average commute (i.e. the model predicted the average distance for that tract to be higher than what it actually was) while 7,822 tracts (11,483,577 commuters) had higher than expected average commutes (i.e. the model predicted the average distance to be lower than it actually was).
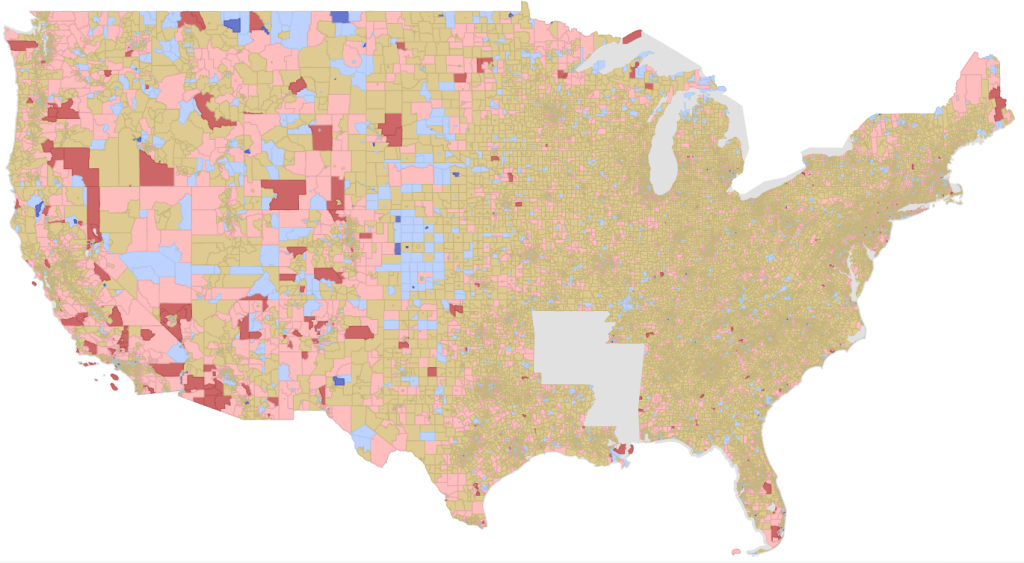

You can see from the map (Figure 1), many of the tracts with higher-than-expected commutes are in the western United States. These areas are also characterized by high land area and low population density. Random Forest will provide details about which variables were the most important when it predicts the output. The most important variable in our model for the average commuting distance predictions was the percentage of jobs in Agriculture, Forestry, and Mining available in the county. Random Forest can only give you the relative variable importance, so to determine if the relationship was positive or negative, we put each variable through a simple linear regression model. If you are interested in other variables and their importance to the model, you can see the table in the appendix at the end of the blog. We also have the direction of the relationships as determined by the linear regression model.
Conclusion
The machine learning model we used to predict the average commuting distance of each census tract worked well with some very interesting results into commute distance discrepancy between the model and our calculations from the OD dataset. Our hope is that planners and decision makers use these results as a jumping-off point for further analysis. Now that we can see where commuting distances deviate from what might be expected, we can start to address the question as to why. In addition, we wish to demonstrate ways in which SparkMap’s national secondary data can be analyzed in tandem to create even more streamlined and accurate analyses of community-level issues. We created a dashboard where users can choose their state and county and view some commuting statistics base on the OD dataset and our model results.
Ready to dive into the analysis? See our analysis for your county and view the dashboard.
Please send any comments or questions about this analysis to Justin Krohn.
Footnote
- The LEHD provides data only for payroll employees, so self-employed people and contractors are not included. The workplace census block may also be the HR headquarters and not the actual worksite which can skew the distance calculations. ↩︎
Appendix
| Variable Definition | Importance (RF) | LM Intercept | LM Coefficient | LM Rsq | Correlation Direction |
| Percent of Jobs Available in the County in Agriculture, Forestry, Fishing, and Hunting | 394890 | 18.03 | 0.819 | 0.078 | Positive |
| Percent of Jobs Available in the County in Information | 301078 | 21.57 | -1.4 | 0.102 | Negative |
| Percent of Jobs Available in the County in Professional, Scientific, and Technical Services | 269766 | 24.1178 | -0.8593 | 0.168 | Negative |
| Percent of Jobs Available in the County in Management of Companies and Enterprises | 262275 | 22.174 | -2.08 | 0.1189 | Negative |
| Percent of Commuters who Reside in Census Tract that work in Good Producing industry | 245836 | 10.95 | 0.505 | 0.19 | Positive |
| Tract is in a county considered Metro as of 2020 (1 Metro, 0 Non-Metro) | 235720 | 27.37 | -10.112 | 0.201 | Negative |
| Percent of Commuters who Reside in Census Tract that work in All Other Service industry | 232781 | 46.72816 | -0.43 | 0.205 | Negative |
| Percent of Commuters who Reside in Census Tract that work in Trade, Transportation, and Utilities industry | 150866 | 10.33 | 0.44 | 0.0418 | Positive |
| Percent of Jobs Available in the County in Administrative and Support and Waste Management and Remediation Services | 137701 | 25.322 | -1.122 | 0.094 | Negative |
| Percent of Jobs Available in the County in Finance and Insurance | 136087 | 23.08 | -1.07 | 0.104 | Negative |
| Percent of Jobs Available in the County in Public Administration | 132988 | 16.513 | 0.48 | 0.042 | Positive |
| Percent of Jobs Available in the County in Wholesale Trade | 132827 | 22.55 | -0.9152 | 0.0377 | Negative |
| Percent of Jobs Available in the County in Real Estate and Rental and Leasing | 127421 | 23.083 | -1.071 | 0.10465 | Negative |
| Percent of Jobs Available in the County in Arts, Entertainment and Recreation | 119312 | 19.021 | -0.0742 | 0.000142 | Negative |
| Percent of Commuters who Reside in Census Tract Aged 30 – 54 | 118883 | 43.88 | -0.469 | 0.057 | Negative |
| Percent of Jobs Available in the County in Manufacturing | 106308 | 16.279 | 0.2778 | 0.057 | Positive |
| Percent of Jobs Available in the County in Transportation and Warehousing | 105211 | 18.78 | 0.039 | 0.0014 | Positive |
| Percent of Commuters who Reside in Census Tract Aged 55+ | 102778 | 8.908 | 0.41 | 0.063 | Positive |
| Percent of Jobs Available in the County in Accommodation and Food Services | 102467 | 15.559 | 0.41444 | 0.0247 | Positive |
| Percent of Commuters who Reside in Census Tract Aged Under 30 | 98746 | 21.05 | -0.097 | 0.003 | Negative |
| Percent of Jobs Available in the County in Retail Trade | 96425 | 8.612 | 0.9422 | 0.082 | Positive |
| Percent of Commuters who Reside in Census Tract Earning Under $1250/Month | 93912 | 15.16 | 0.155 | 0.011 | Positive |
| Percent of Commuters who Reside in Census Tract Earning between $1251-$3333/Month | 88747 | 16.62 | 0.28 | 0.07 | Positive |
| Percent of Commuters who Reside in Census Tract Earning $3333+/Month | 84998 | 25.98 | -0.152 | 0.052 | Negative |
| Percent of Jobs Available in the County in Health Care and Social Assistance | 84766 | 22.245 | -0.207 | 0.0165 | Negative |
| Percent of Jobs Available in the County in Educational Services | 79519 | 14.67 | 0.4425 | 0.0398 | Positive |
| Percent of Jobs Available in the County in Utilities | 77570 | 17.702 | 1.9021 | 0.036 | Positive |
| Percent of Jobs Available in the County in Other Services (Except Public Administration) | 74918 | 23.227 | -1.499 | 0.025 | Negative |
| Percent of Jobs Available in the County in Mining, Quarrying, and Oil and Gas Extraction | 72152 | 18.61 | 0.576 | 0.0198 | Positive |
| Percent of Jobs Available in the County in Construction | 68994 | 16.03 | 0.519 | 0.024 | Positive |