
Identify Community Strengths and Opportunities
Developing a deep understanding of your community strengths or opportunities gives you the power to make impactful data-based decisions. Three footprint tools in the SparkMap Map Room allow you to do this at the click of a button: the Community Demographic Mapping Tool, the Location Opportunity Footprint Tool (LOFT) and the Vulnerable Populations Footprint Tool (VPF).
In this blog, you will learn all about leveraging the power of your three new time saving secret weapons: Community Demographic Mapping, LOFT, and VPF.
Accessing the Tools
Each of these tools can be accessed in the SparkMap Map Room. Once there, navigate to the “Tools” button on the left menu. Once you’ve selected Tools, you should see the option to select Community Demographic Mapping, LOFT or VPF amongst other tools. For a complete tutorial on how to use Community Demographic Mapping, LOFT, or VPF tools, check out the SparkMap Support pages.
Community Demographic Mapping
One of the best ways to learn about your service area is to understand the people that live and work in it. The Community Demographic Tool lets you get a quick snapshot of an area (i.e., county, city or town, census tract, or state). Once an area is selected, a report will be generated providing detailed population information.
These reports are quick to generate and packed with important information. With a Community Demographic Profile, you will receive information on community poverty levels (Figure 1), educational attainment, population, persons per square mile, gender, age, and race/ethnicity (Figure 2).


Location Opportunity Footprint Tool
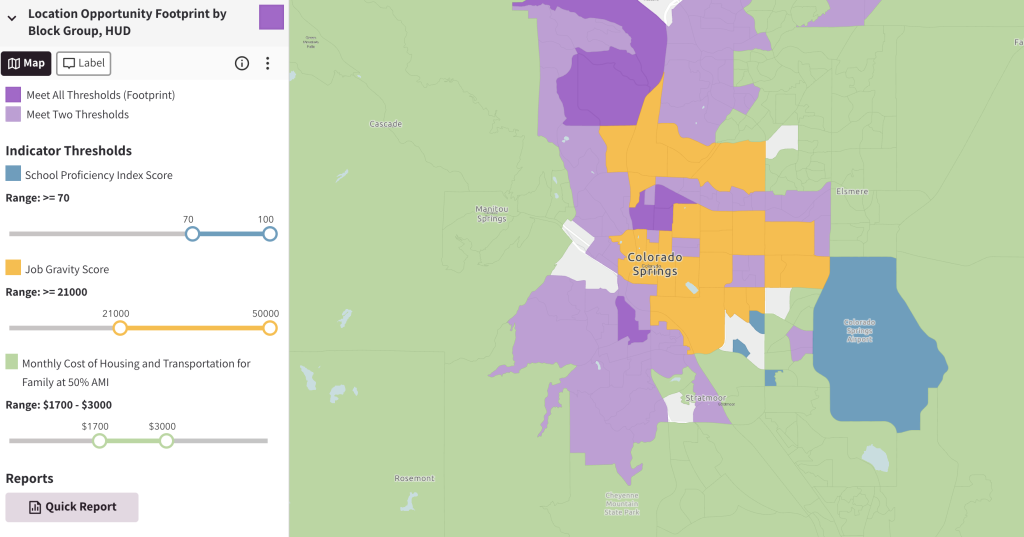
The LOFT was created to identify areas of opportunity based on school proficiency, job gravity, and cost of living. Essentially, the foundation of the Tool rests on the idea that areas with better schools, more job opportunities, and lower housing and transportation costs provide greater opportunity.
A unique feature of the LOFT is that you can set the school proficiency, job gravity, and transportation and housing costs to the ranges you’re looking for and the map will dynamically update to show areas that meet one, two, or all three thresholds (Figure 3).
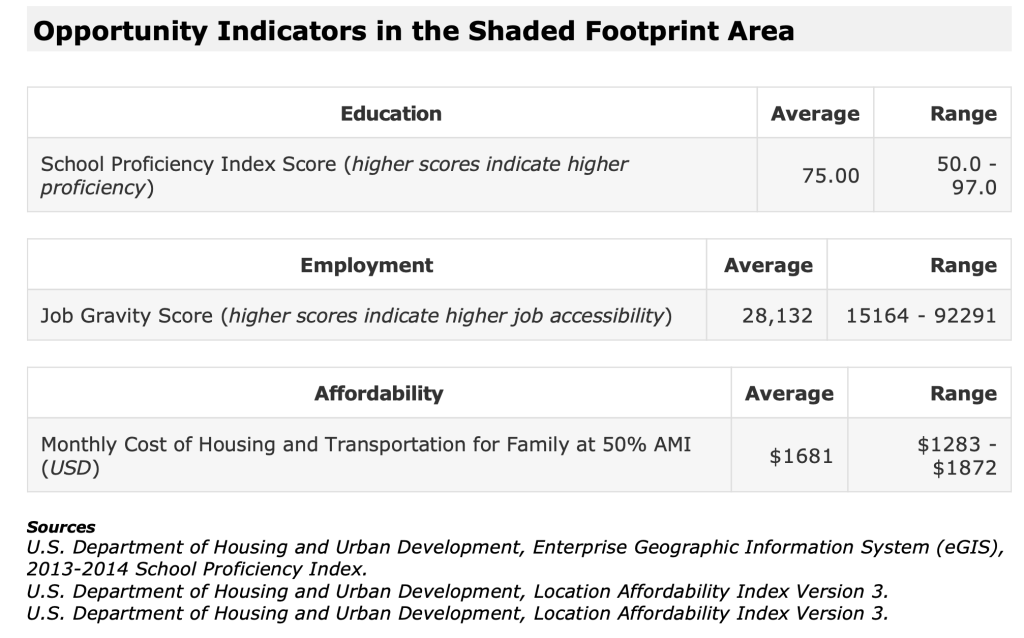
In addition to the map, you can generate a Quick Report of the LOFT data. In this report, you will receive more detailed information on the areas of your map that meet all three thresholds. This will include basic demographic and breakout data like race/ethnicity information, gender, and age (Figure 4).
Vulnerable Populations Footprint Tool
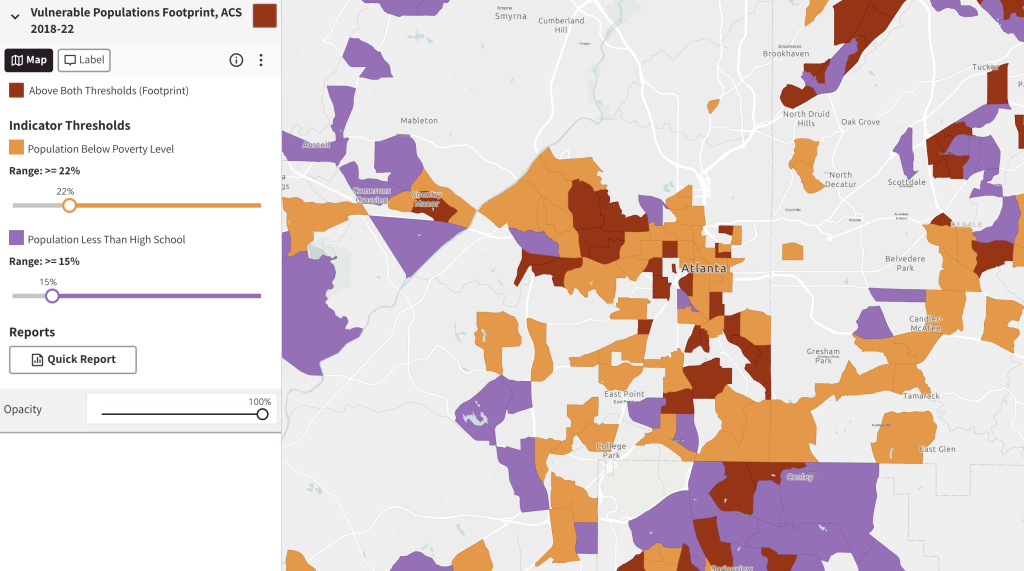
Highlighting strengths in a community is helpful, but the SparkMap team also wanted to provide you with a quick way to understand the most prominent areas of need in a community. Thus, we created the VPF. The VPF Tool highlights areas of need based on two data-backed criteria: population below poverty level and population who have completed less than high school. As with the LOFT, you can adjust the thresholds of the percentage of the population living below poverty and population with less than a high school degree to meet specific requirements you might be looking for. Once you’ve adjusted the thresholds, areas in red meet both criteria, areas in orange meet the poverty criteria, and areas in purple meet the education criteria (Figure 5).
With the VPF, you can generate a similar Quick Report which will provide additional demographic data on areas within your map view that meet both thresholds (Figure 6). These may be considered areas of highest priority.

Why use the Footprint Tools?
The Community Demographic Mapping, LOFT, and VPF are great starting places to support your work. With the click of a button, you can immediately understand who lives and works in your community and identify areas of opportunity and vulnerability. Take your work a step further by adding layers like Business Births or Job Creation alongside LOFT to focus on areas of economic growth. Or, add layers like Head Start Facilities and Childcare Costs alongside the VPF to understand more about the potential childcare burden placed on families in highly vulnerable communities.
When you root plans in data, there is no telling how your communities can grow and flourish. Community Demographic Mapping, LOFT, and VPF tools provide three quick ways to learn about your community and make data-based decisions.
We can’t wait to see what you do!