SparkMap’s 2023 in Review
2023 was another record-breaking year at SparkMap! Looking back on the year, we completed a site redesign, started Data Dives, introduced a brand-new payment and subscription management system, and continued to develop new tools we’re looking forward to unveiling. Thank you for another great year at SparkMap!
While the site grew and changed last year, you made more Maps and Community Needs Assessments than ever. Let’s review!
Your 2023 SparkMap Year by the Numbers
25,815 maps made in 2023!
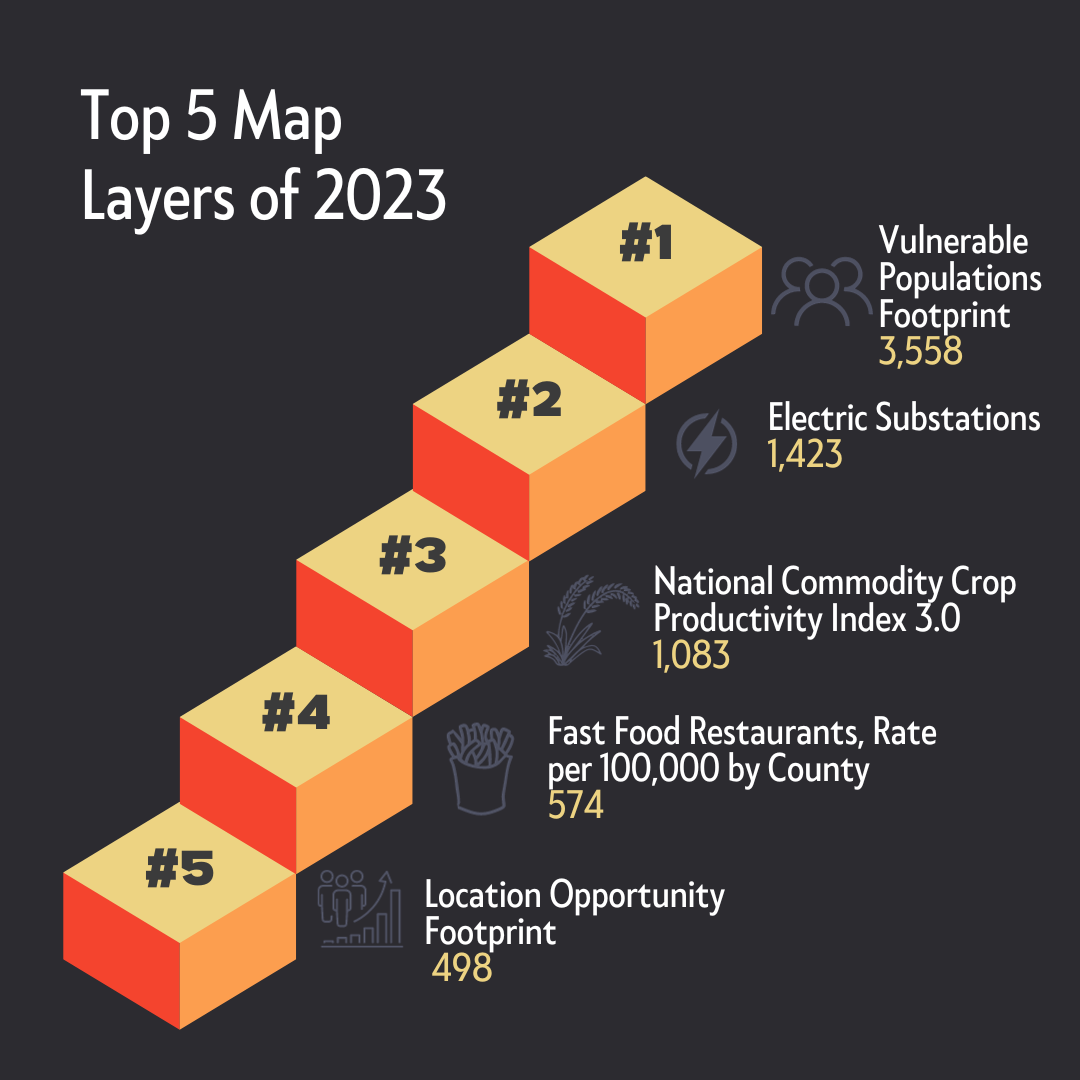
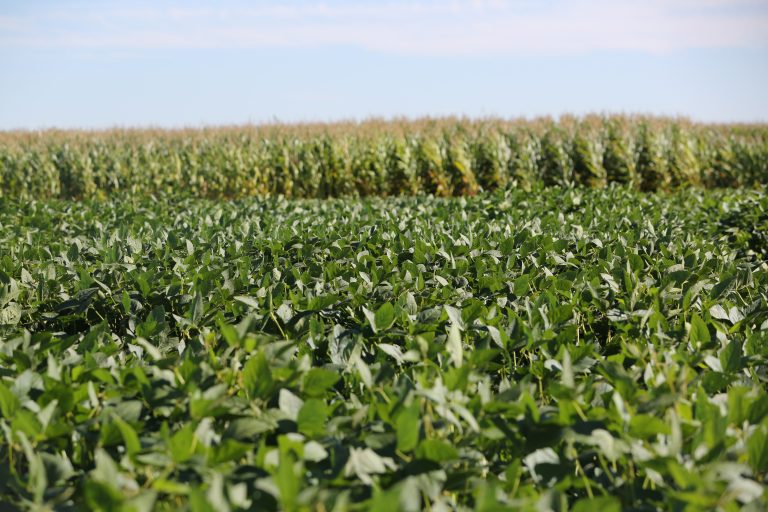
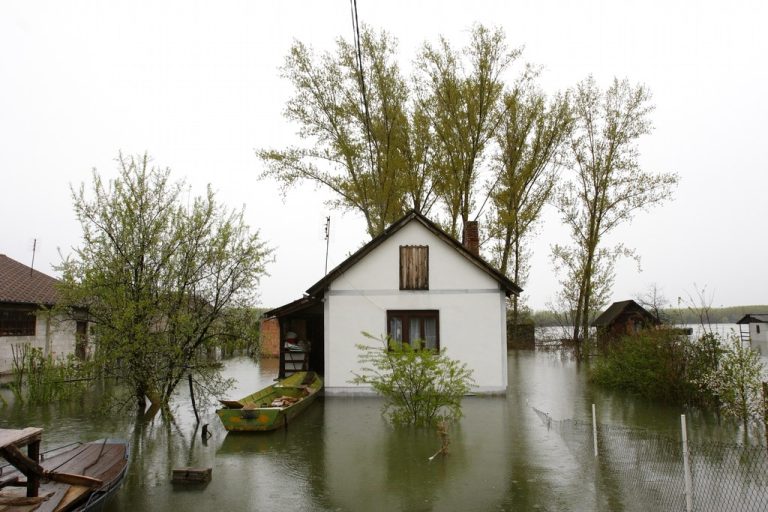
In 2023, you made nearly twice the number of maps as 2022! This year, you were interested in a variety of layers: from footprint tools, to agricultural data, and food access information. Plus, for the second year in a row, the Vulnerable Populations Footprint was the most used map layer with it appearing in 3,558 unique maps! If you haven’t yet, we recommend checking at our top five most used layers of 2023: the Vulnerable Populations Footprint tool; Electric Substations; the National Commodity Crop Productivity Index 3.0; Fast Food Restaurants, Rate per 100,000; and the Location Opportunity Footprint.
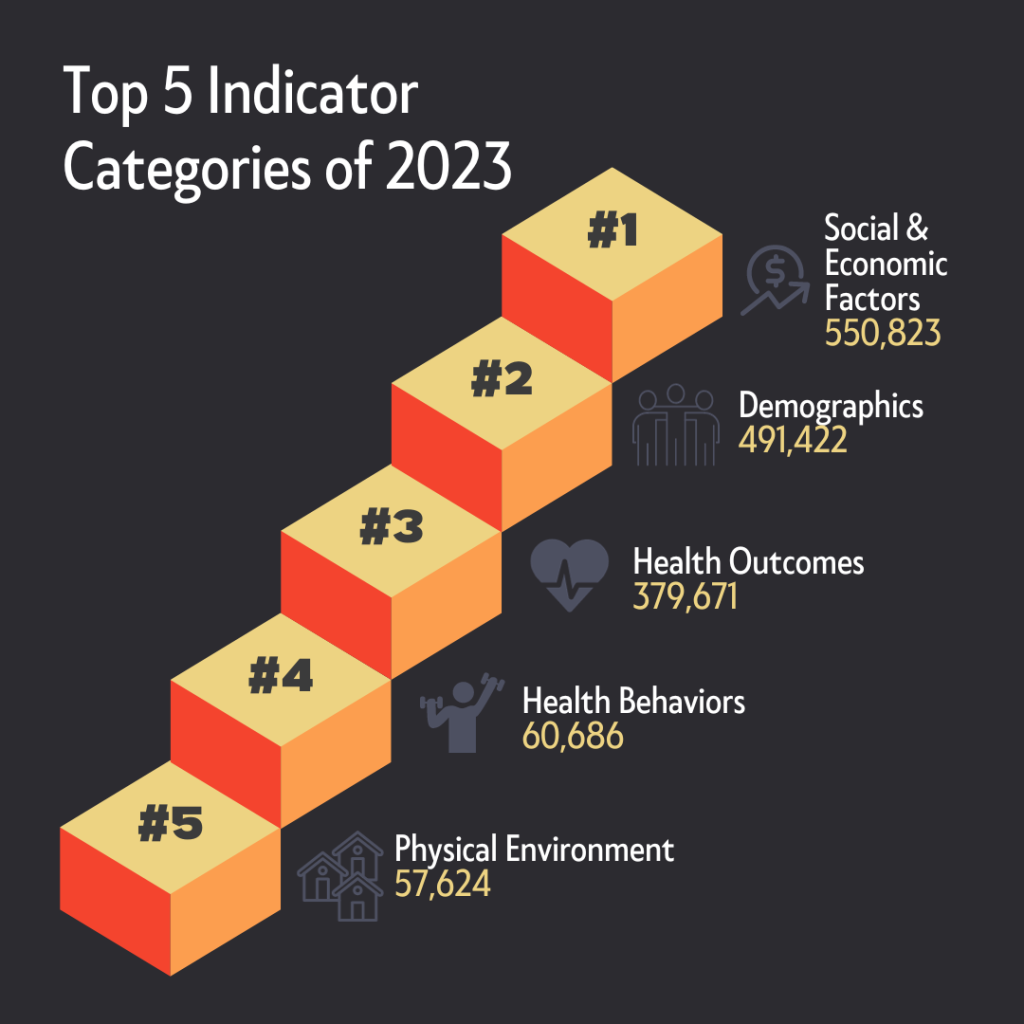
95,190 Community Needs Assessment Reports created!
In 2023, you created over 95,000 Community Needs Assessments; that’s over 30,000 more than 2022! What a tremendous year for community impact. The top priority for you this year was gaining insight into social and economic elements that impact the members of your communities. The most popular indicator categories this year included Social and Economic Factors; Demographics; Health Outcomes; Health Behaviors; and Physical Environment. You were especially interested in Total Population, Poverty Rate, Diabetes Prevalence, Physical Inactivity, and Substandard Housing. Explore our indicators to expand your impact this year.