All About Broadband
If you have been paying attention to the news, you have likely heard about the billions of dollars that were allocated and are starting to be released for broadband funding through legislation like the Broadband Equity Access and Deployment Program (BEAD) and the Infrastructure Investment and Jobs Act (IIJA). Broadband is critical to modern day life. This became even more apparent when the pandemic exacerbated issues with broadband access as employees and students doing their work from home tested the limits of their internet connectivity. Band-aid solutions were deployed, such as free-Wi-Fi at libraries, schools, restaurants, and government buildings and temporary hot spots given to families so that students could complete their schoolwork. However, none of these solutions addressed the fundamental issue: many households and businesses do not have access to the internet at speeds required for their needs.
In this blog, I’ll answer:
- What is broadband?
- What impacts a broadband connection?
- How does SparkMap fit into this?
- What are the strengths and weaknesses of data on broadband?
What is broadband?
Broadband, as it is currently defined, is a connection to the internet with a download speed of at least 25 megabits per second (MBPS) and an upload speed of at least 3 MBPS. This level of speed is good for about one high quality video stream through a service like Netflix, as long as no other devices are connected. If you have two or more people trying to stream, video conference, or play a game online, then this speed is likely insufficient.
What impacts a broadband connection?
One of the main factors that can determine the quality of a broadband connection is the technology type. A copper wire connection through DSL doesn’t allow for a symmetrical connection, where the upload and download speeds are the same. With DSL, if you are uploading data, such as with Zoom where your video is being streamed out to others on the call, then your download speeds can be affected. Technology such as fiber gets around this limitation and allows for symmetrical upload and download speeds.
Another aspect of an internet connection to pay attention to is latency. Latency is the time it takes for data to travel across the network. Some technologies have higher latency than others, meaning that it takes more time for data you send from your device to get to its destination. Low latency technologies are important for real time internet activities. For example, hosting a webinar would require low latency to avoid lag and disruption for viewers. Some technologies, such as satellite and wireless internet, may offer speeds that are considered ‘broadband’ but have higher latency than other technologies such as fiber or cable, making tasks such as video conferencing more difficult.
How does SparkMap fit into this?
Planners, economic development professionals, government officials, and many others need to keep close tabs on broadband availability and accessibility to ensure a wide array of needs – from educational services to medical care – are being met across their communities or service areas. The Federal Communications Commission (FCC) publishes a variety of data around broadband availability and funding, but for the average person, it can be a little daunting to acquire the data. One of the most important datasets available is the FCC FABRIC Locations. This is a point level dataset for each broadband serviceable location (BSL) in the country. For each BSL, individuals can see the service providers available, the technology type, and the advertised speeds. For Subscribers who are interested in a particular geographic area, we have summarized the data at the block group, census tract, and county level maps, available for free in the Map Room. Available map layers include locations with access to 100/20+ MBPS speed, 25/3+ MBPS speed, total number of providers, and the percent of locations with broadband access through wireless internet alone.
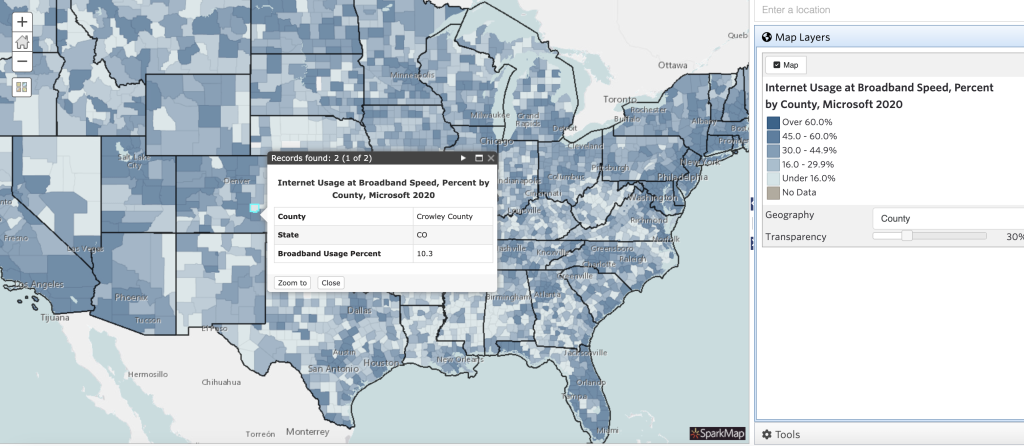
In addition to the FCC datasets, we have usage data from Microsoft (Figure 1). This dataset contains summarized speed data from devices that get updates from Microsoft and displays the overall percentage of devices that are actually meeting the broadband definition when they are downloading updates from Microsoft.
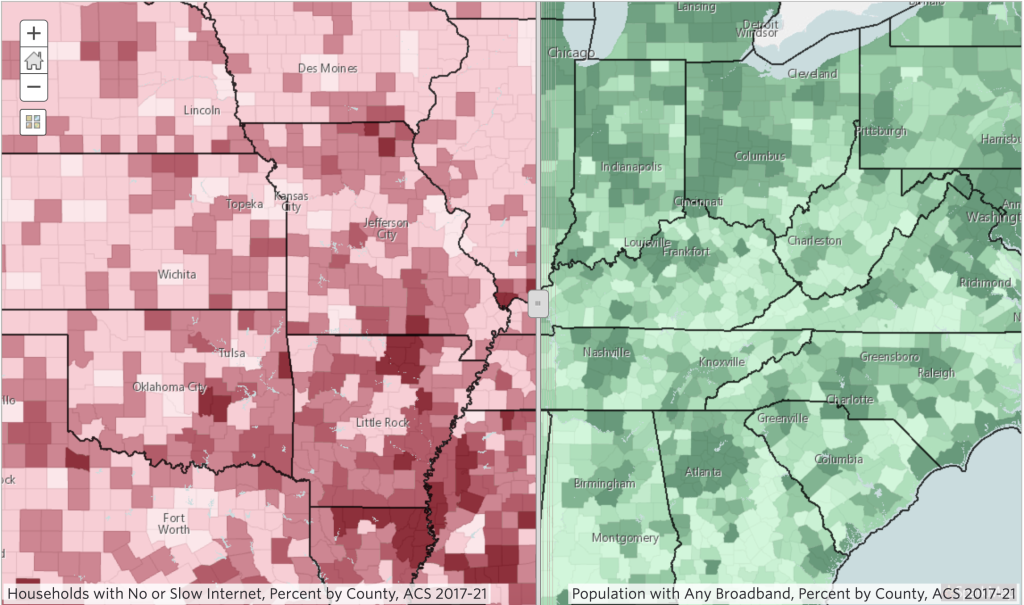
We also have broadband data from the American Community Survey (ACS) that is self-reported by respondents (Figure 2). These datasets include access to broadband, no or slow internet, and access to the internet through various technologies. These datasets provide a more nuanced perspective on broadband availability and use, as the FABRIC tends to overstate accessibility.
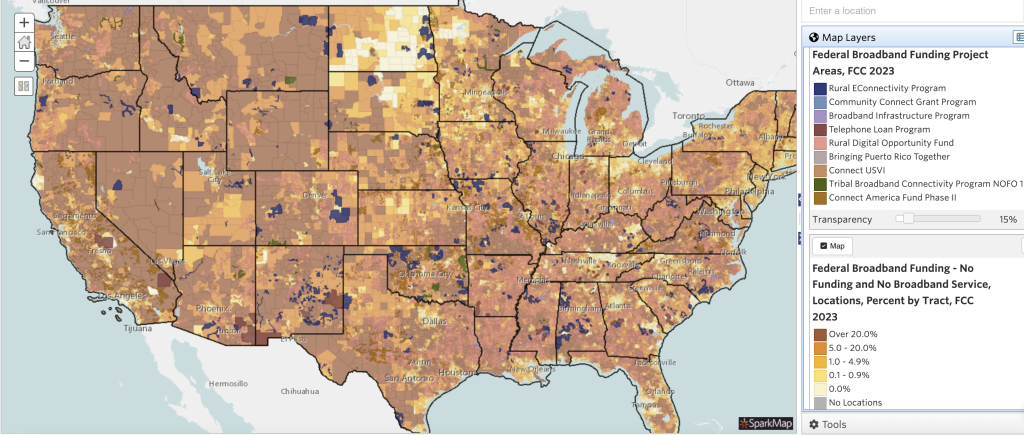
In addition to data on internet access and usage we also have map layers for various broadband funding opportunities available over the last several years. Beyond funding areas, we also have estimates for the number of locations that have received no funding and do not have access to broadband services for each census tract and county (Figure 3).
What are the strengths and weaknesses of data on broadband?
Each of these datasets have their pros and cons. On one hand, the FCC fabric dataset has been widely criticized for its inaccuracies. However, it is unique in that it theoretically covers every location in the states. Many BSLs are missing, others have service levels overstated, and then there are BSLs that appear in the data that aren’t actually there in reality. The FCC has set up a challenge process for this dataset, so it should continually improve over time, but it’s important to understand its limitations.
On the plus side, the Microsoft dataset provides actual measured speed. However, it doesn’t consider the service level that is being paid for, or connection type, so the usage speed could be affected simply by people paying for a lower level of service than the maximum that is available to them.
Lastly, the ACS provides a picture of availability beyond what is reported by internet service providers (ISPs). But, this data is all self-reported by responding to a question that asks if the participants have access to broadband or high-speed service, without defining the service level that qualifies as broadband. Additionally, the ACS has wider margins of error in rural areas and smaller geographies as getting a big enough sample size for accurate results is more difficult in these areas.
These data sets are important and useful when trying to understanding broadband access and availability in your community or service area. However, it is essential to be informed on both the strengths and weaknesses of data so it can be used to guide on the ground exploration, rather than taken as objective truth in and of itself.
Conclusion
While these datasets can help planners, economic developers, civil servants, and citizens assess broadband availability in their areas, they still don’t provide a complete picture of the problems households and businesses face with not having access to the internet speeds they need. There’s still a fundamental problem of access: even if the technology is technically available, it doesn’t mean that it’s affordable for or accessible to everyone. There’s still a large need for digital skills training and affordable internet options to maximize utilization.
This is why, at SparkMap, we encourage subscribers to use our data alongside their own local knowledge. The secondary data highlighted above can significantly aid community assessment and plan development, as well as development of proposals and funding applications. We can help you take the first step in gaining a full understanding of your community’s broadband situation by providing the most reliable and accessible data. With our data and your local knowledge, you’ll be on your way to appropriately applying broadband funding and improving lives in your community and service areas.