American Community Survey 2016-2020 data has arrived! Here’s what you need to know.
The long-awaited American Community Survey (ACS) 2016-2020 data is officially live on SparkMap! We’ve been teasing this update for a while and are excited to help you update your maps and Assessments. To make sure this transition is as smooth as possible, we’re here to walk you through this process step by step. This blog post will cover:
- What is the ACS?
- What has been updated on SparkMap?
- Can I compare ACS 2016-2020 with data from ACS 2015-2019 or earlier?
What is the ACS?
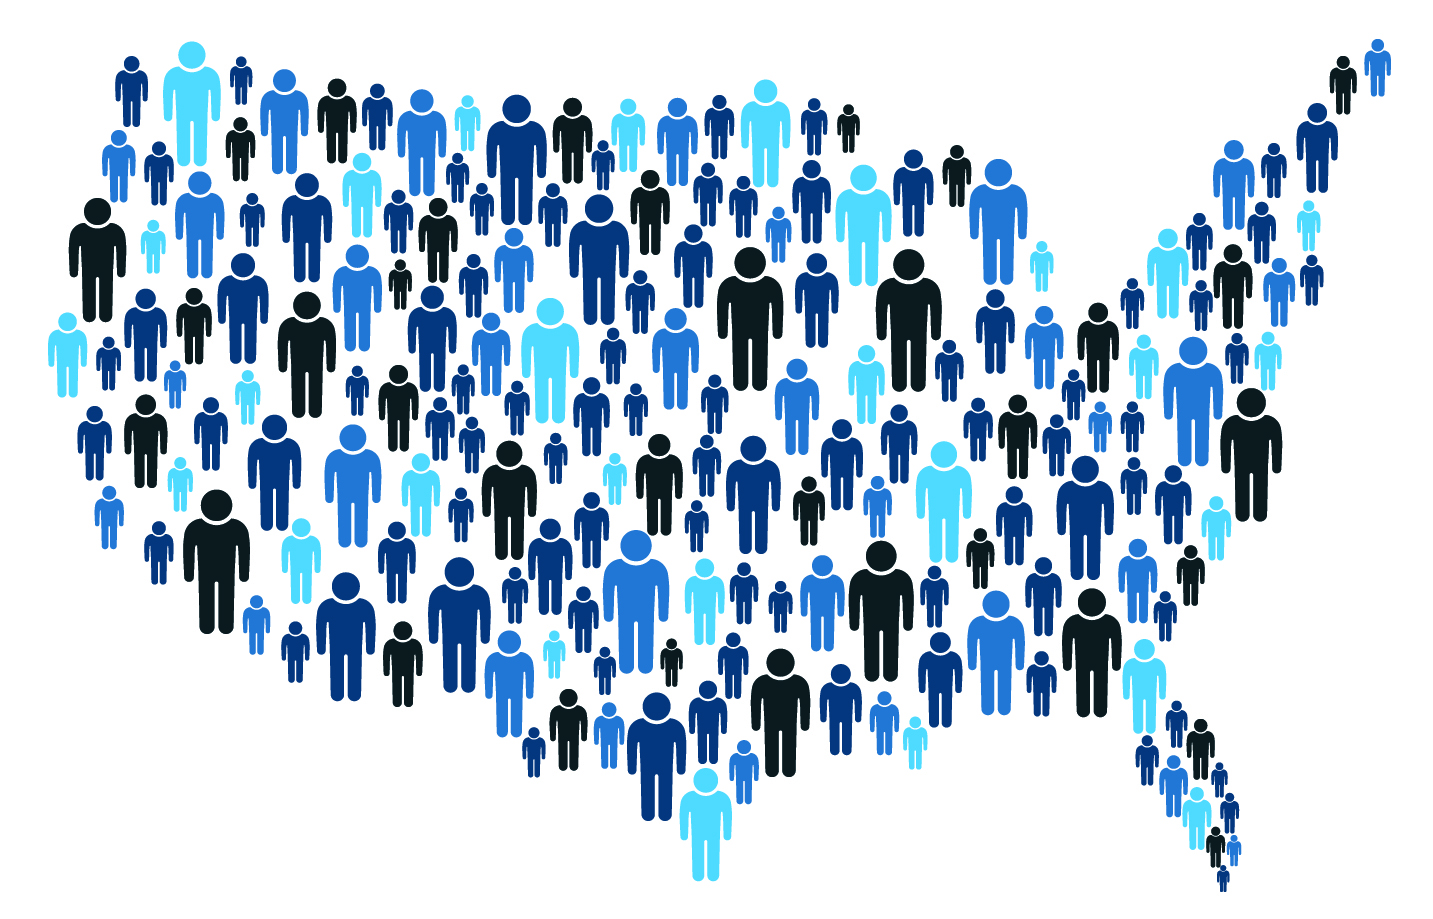
To begin, it’s important to have a little bit of background on ACS to know if the updated data will impact you. The ACS is a yearly survey conducted by the US Census Bureau to gather information about the United States and its residents.1 Specifically, the survey gathers information about jobs, educational attainment, employment status, housing, demographics, and more! So, if your work pertains to understanding and improving communities, ACS data is likely relevant to you.
On SparkMap, we have updated the 2016-2020 5-year estimate data. This data is collected over a 60-month period, making it more reliable overall, and especially for areas with lower populations and small population subgroups.2 Because of the increased reliability of 5-year estimates, we do not update the ACS 1-year estimates, thus will not be adding the ACS 2020 experimental data. To read more about the experimental data, visit the US Census Bureau website.
What has been updated on SparkMap?
It is typical procedure for SparkMap to continually update layers and indicators when more recent and accurate data is released. So, why have we talked about the ACS update so much? There are a large number of layers and indicators from ACS that we know are frequently used by our subscribers. Therefore, it’s likely you’ll see changes from the ACS update you may not have noticed before.
What, specifically, is changing?
- Additional layers in the Map Room. Over the last month, we have updated the Map Room to include all ACS 2016-2020 layers. This means when you search something like “income” or “enrollment in school” you’ll be able to add the most updated 2016-2020 data to your maps. When we update the Map Room, we add new layers while retaining the old ones. So, you’ll still be able to add ACS layers from previous periods, all the way back to the 2012-2016 period if those are of interest to you. Be sure you keep a close eye on which layers you’re choosing to make sure you’ve selected the appropriate ones.
- Updated Assessment indicators. In contrast to creating additional layers in the Map Room for the ACS update, in the Assessment, we have updated indicators, which override previous ones. So, if you have current reports using ACS 2015-2019 indicators, they have now been replaced with ACS 2016-2020 indicators.
- What if I forgot to download my report with 2015-2019 indicators? Am I doomed? Nope! We’ve created an Assessment report for you with all the 2015-2019 indicators available. It is important to note, this report will honor old geographies and will not update with 2020 vintages as discussed further below.
Can I compare ACS 2016-2020 data with data from ACS 2015-2019 or earlier?
The answer is… complicated. The first thing to note is that since the ACS data represent a 5-year period, comparing with the previous releases can result in comparisons of “overlapping” time periods. The Census Bureau does not recommend statistical comparisons of data from overlapping time periods.3 In addition, there are some important changes in the updated ACS data that will impact your ability to compare between previous and current data. Most notably, ACS has changed Census Tract and Place geographies. For a complete list of the vintages (i.e., boundaries) for each geographical area we recommend visiting the Census Website.
You might be wondering why geographical boundaries changed this year and how it impacts your work. Geographies change to reflect population change.4 As more people move to an area, it may split, and as people leave, there may be areas that merge. As a result, geographical codes change and spatial modifications occur. Previous ACS releases used the 2010 vintage, so, if you’ve been examining data at the Census tract or place level since then, it is important that you check and see what geographical changes may have occurred. (Insider info: the US Census Bureau has alluded to changing ZIP Code areas in future releases, so keep this in the back of your mind).
How can I tell if geography changes occurred?
The best way is to compare the 2019 and 2020 estimates for your area of interest using our Map Room. Below, we’ll walk you through how to do this.
- Go to the Map Room and in the popup box search “Tract Boundaries TIGER” if you’re interested in Census tract changes. If you’re interested in place changes, search “City/Place Boundaries TIGER.” We use the TIGER layers because they show the geographical boundaries the Census uses.
- Select both the 2020 and 2019 layers.
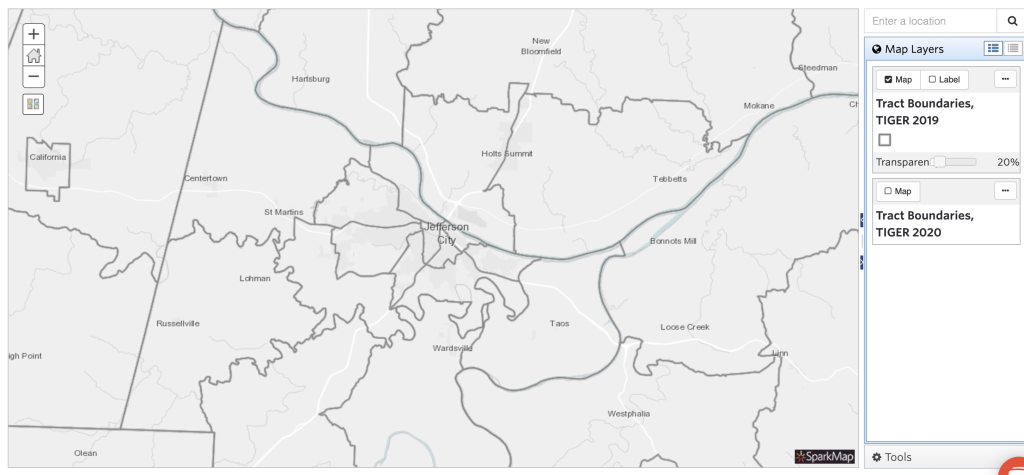
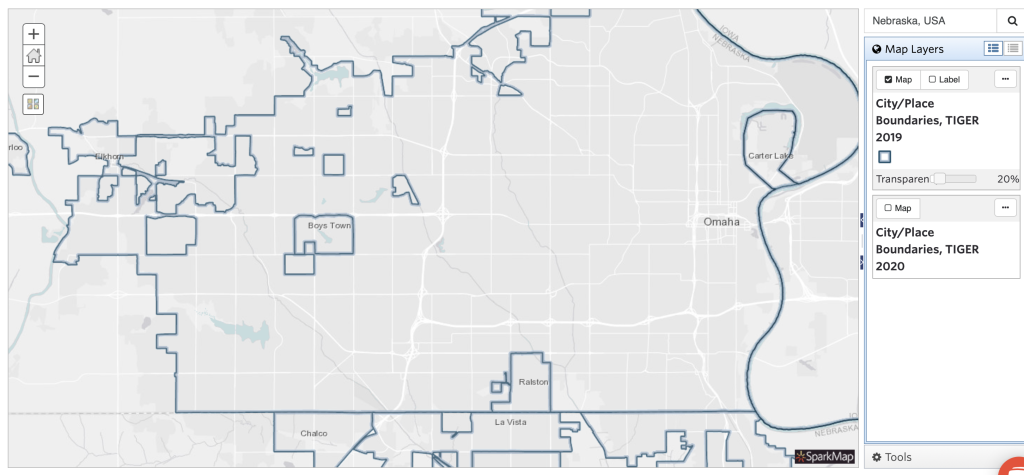
- Once you’ve added the layers to your map, search your location of interest. For the examples below, we use Jefferson City, Missouri for tract changes, and Omaha, Nebraska for place changes.
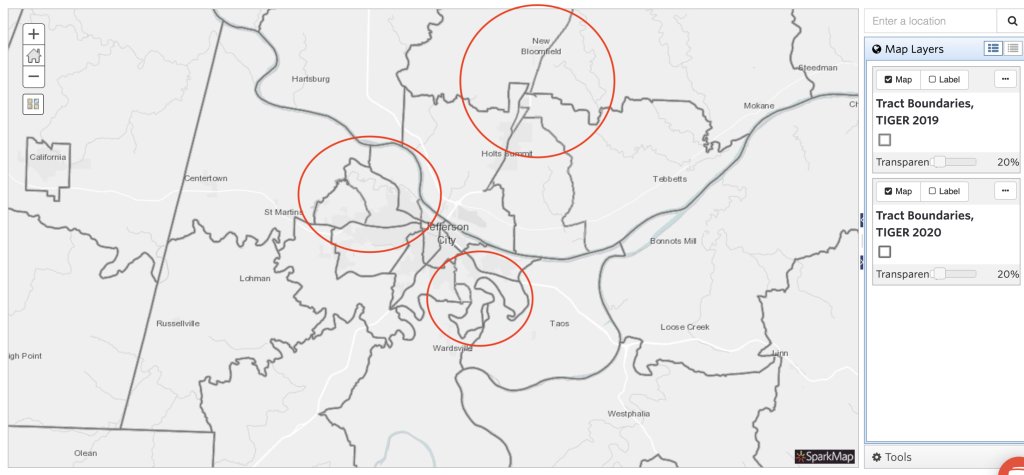
- Toggle the layers on and off to see how your geographies have changed (image 1).
- Remember to click on the map for more information about geography changes, like name, land area, and total area (image 2).
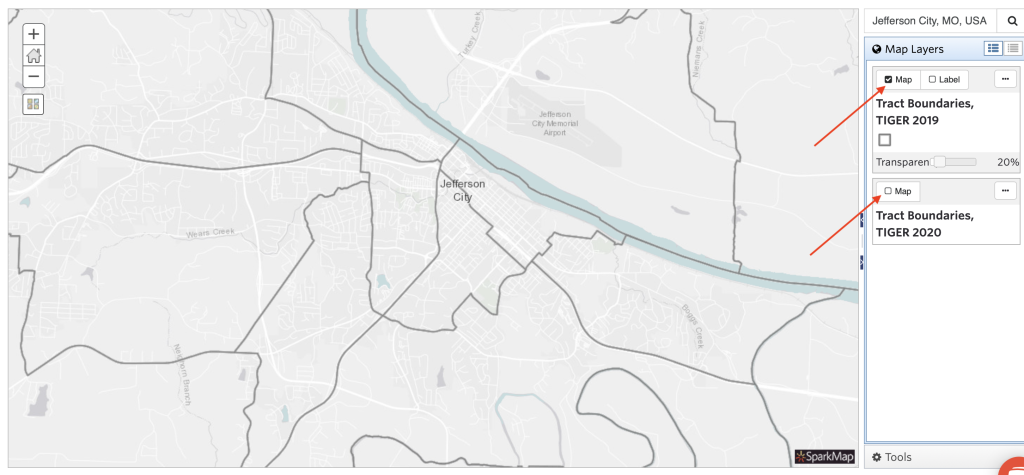
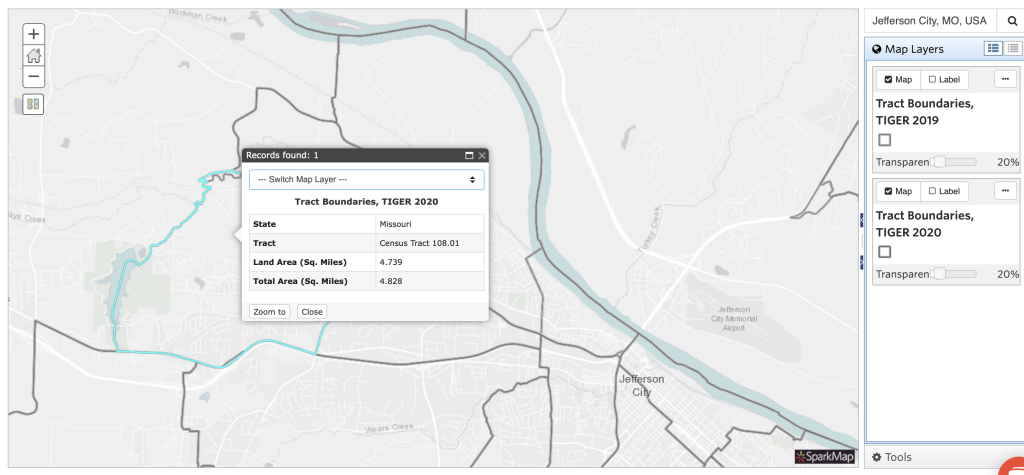
Below, we’ve included two images to demonstrate tract changes in Jefferson City, Missouri. Can you spot the changes?
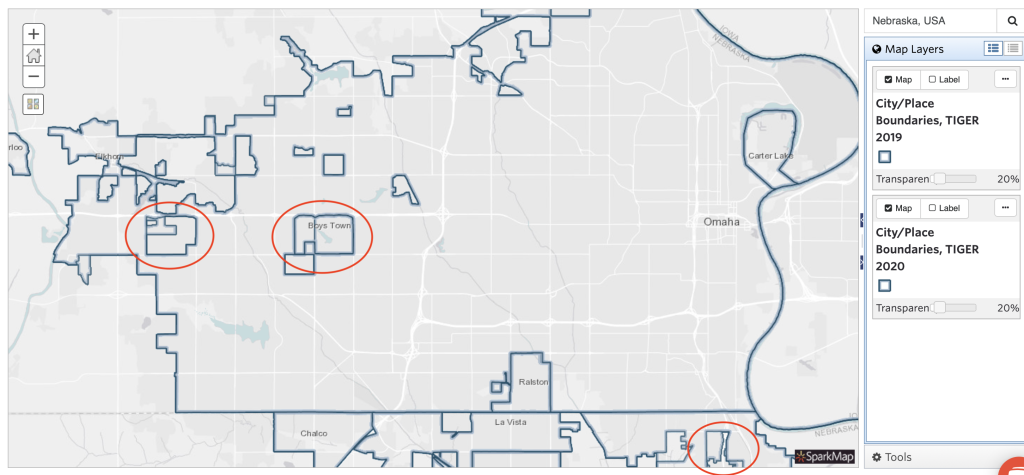
Further, we’ve included some examples of place boundary changes in Omaha, NE. Can you spot the differences?
Overall, it’s critical that you check for geography changes before discussing ACS 2016-2020 data because these changes might impact the validity and accuracy of comparisons you make between 2019 and 2020 data. If your area of interest hasn’t changed, then great! Move forward as normal. However, if it has, you’ll need to be sure to note splits, merges, and new geographies rather than comparing new areas to old ones. For more information on comparing ACS data, we recommend visiting the Census Bureau’s data comparison guide and handbooks. As always, if you have any questions email us at sparkmap@missouri.edu.
Ready to see ACS updates in action? Register for our upcoming webinar on June 8 from 2:30-3:30 pm CST.
Sources
- https://www.census.gov/programs-surveys/acs/about.html
- https://www.census.gov/data/developers/data-sets/acs-5year.html
- https://www.census.gov/programs-surveys/acs/guidance/comparing-acs-data.html
- https://www.census.gov/programs-surveys/acs/technical-documentation/table-and-geography-changes/2020/geography-changes.html