Public Education Funding and Student Outcomes
It’s back to school time around the United States. While parents and teachers are purchasing last-minute school supplies, departments of education and school administrators are making crucial spending decisions with their allotted budget. Most know that free public education is a right guaranteed to all students in the United States. However, how these schools are funded, what they spend their money on, and the links between public education spending and long-term student outcomes are a more complicated matter. Using SparkMap data, you can create multilayer maps and in-depth assessments to explore links between public education funding and student outcomes. By examining trends over time, you can track and conclude the impact of public education funding in your community.
In this blog post, we’ll discuss:
- Background on Public Education Revenue and Expenditures Data on SparkMap
- Public Education Revenue Sources and Figures
- Public Education Expenditures
- Links Between Public Education Expenditures and Student Outcomes
- Unpacking Public Education Expenditures and Outcomes in your Community
Background on Public Education Revenue and Expenditures Data on SparkMap
The top source for data related to education in the United States is the National Center for Education Statistics (NCES)—this is the source from which we glean our public education expenditures and revenues data.1 Located within the US Department of Education and Institute of Education Sciences, the NCES is charged with collecting, analyzing, and reporting key statistics and reports indicating the status of education in America.
Data for public education revenue and expenditures doesn’t just come from the national level. Information from each individual school district compiled by state education agencies is essential to understanding education funding in your area. The NCES compiles local statistics on education—such as the total number of full-time-equivalent teachers and financial reports—through the Common Core of Data, an annually published database.2 SparkMap integrates both the national and local data collected by the NCES CCD. These data allow SparkMap users to take a multi-level approach when looking at public education.
Public Education Revenue Sources and Figures
Take a moment to consider where public education funding comes from. The vast majority of it comes from government funding—from various taxes and government programs. For many people, the federal government may come to mind as the primary source of funding. However, the federal government is the smallest contributor to public education revenue. In the 2018-2019 school year, public education as a whole had a revenue of roughly $764.7 billion.3 The federal government contributed just under 8% of this money, totaling around $60.3 billion. State and local governments, then, contributed 92.1% of the funding, totaling roughly $704.4 billion.
Why do these numbers matter? Whether you are directly affiliated with public education or not, a large part of the funding comes from tax dollars. Therefore, you are directly contributing to the education system. It is important to be informed on how this money is spent and how public education revenue and expenditures are related to long term outcomes to help affect positive change in current and future generations.
Public Education Expenditures
By many accounts, $764.7 billion is a large operating budget. However, public education routinely has more expenditures than revenue, suggesting that revenue dollars are deficient for operating public schools. For example, in the 2018-2019 school year, federal, state, and local governments in the US spent roughly $769.0 billion on public elementary and secondary school expenses.3
With a disparity between revenue and expenditures, it is important to understand what the money is being spent on. Overall, this comes to a national average of $13,187 spent per pupil, yet individual states vary widely. When broken down like this, $769 billion actually isn’t as astronomical as it sounds. Total expenditures per pupil are allocated to costs including salaries, employee benefits, tuition, supplies, instructional staff support services, student support services, general administration, school administration, operation and maintenance, student transportation, business services, food services, and capital outlay.4 Capital outlay includes expenses for the property and buildings of schools, as well as interest on school debt.5
Overall, public education is one of the largest enterprises in the United States. Although overspending is problematic and results in accrued interest, there are benefits to increased student spending which may motivate all of us to search for ways to increase public education revenue.
Links Between Public Education Expenditures and Student Outcomes
The link between public education spending and student outcomes has been a hot topic of debate for over 50 years.5 On one side, some scholars have reported no link between school spending or quality on student educational attainment. On the other side, more recently scholars argue that a link does in fact exist. Both sides have research to support their opinions; however, an important distinction must be made. Scholars who argue that education and school spending are not linked look primarily at one metric: standardized test scores. The other group of scholars, however, looks at different metrics, such as educational attainment, long term earnings, and subsequent level of poverty. When scholars consider metrics beyond standardized test scores, a strong relationship between school spending and long-term outcomes of students emerges.
For example, a widely cited body of work has forwarded four central conclusions regarding the relationship between public education expenditures and student outcomes.5 First, they found that increased school spending was related to increased graduation rates and adult income. Next, they found that low-income students benefitted the most from increased spending. Specifically, students from low-income families spent more time in school, had significantly higher graduation rates and adult income, and had a significantly decreased chance of living in poverty as adults.
This work not only found that increased spending was beneficial, but they also found that how money was spent mattered. For example, upgrading buildings with the latest technology might be flashy, but what really made the difference was spending more on instruction and support services leading to lowered student-to-teacher ratios, longer school years, and increased teacher and support salaries.5 Finally, this work found that even though increasing spending can be challenging, it is worth it. Overall, the team found a cost benefit ratio of 1:2, providing evidence that for every additional dollar spent, there is a $2 increase in additional future earnings by the students.
What’s the takeaway? Researchers disagree on whether increased public education spending leads to better student outcomes. When examining the links between funding and student test scores, the results are mixed. However, there is a statistical relationship between public education funding to higher graduation rates, higher adult wages, and a lower likelihood of adult poverty.5 Further, as low-income students tend to benefit the most, increased school spending may be an important element to breaking the cycle of poverty.
Unpacking Public Education Expenditures and Outcomes in your Community
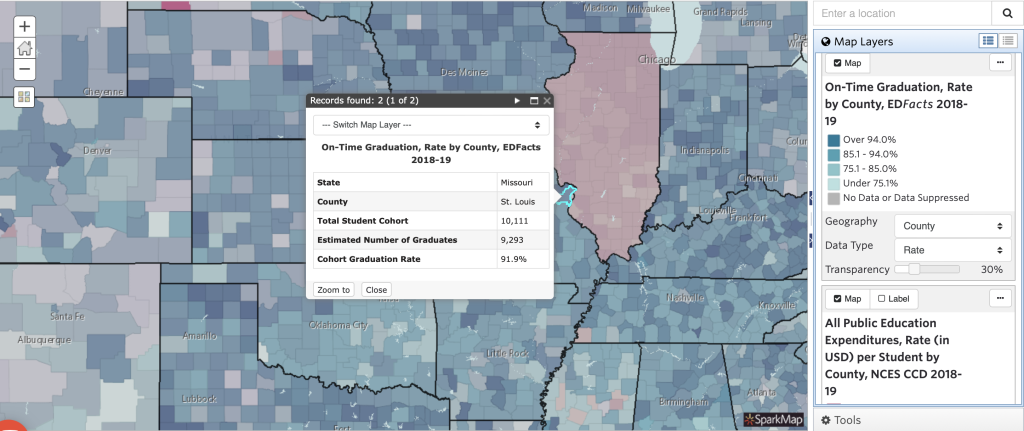
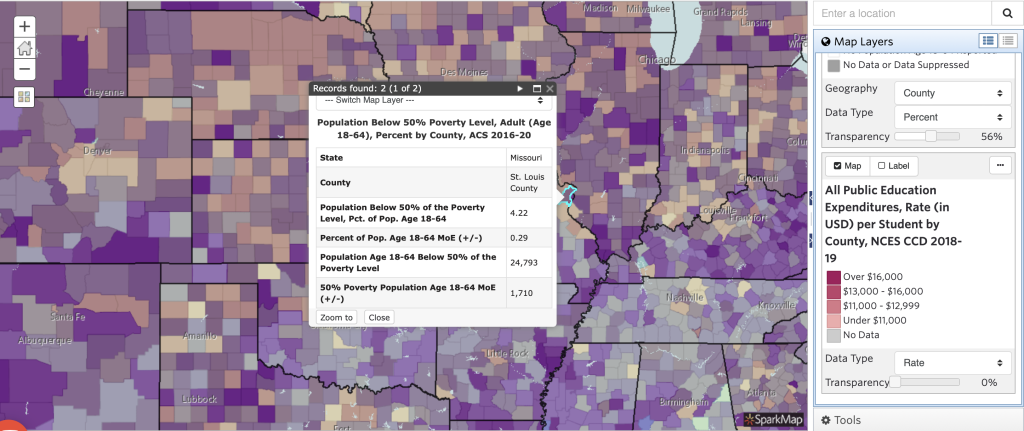
Armed with this information, we challenge you to examine school revenue and spending in your county. However, don’t stop there. Consider looking at graduation rates, income, poverty, and educational attainment in your community, as we have done in Figures 1 and 2. When examining these indicators over periods of time, do you notice any trends? Keep in mind, creating and interpreting multilayer maps can be challenging. Refresh your knowledge on making and interpreting multilayer maps by revisiting our recent blogs on data literacy and multilayer maps.
We challenge you to create these maps, put your data literacy skills to use, and share what you’ve learned with us. Tweet us @Sparkmap_org or tag us on LinkedIn @SparkMap and let’s talk about your community!