Tracking Data Trends Over Time: Enhancing Data Literacy pt. 3
Focusing on trends in data over time is interesting and impactful. Understanding which job sectors have grown in the last five years, illuminating areas of increased health disparity, or tracking migration patterns within the country are important for community development, resource allocation, and legislative efforts. While it’s easy to assume data from the same sources on the same topics can be compared year to year, that isn’t always the case. In this blog, we’ll highlight three Dos and Don’ts of interpreting trends in data.
Changes in Geographical Boundaries
- Don’t assume data is reported for the same geographies over time. Do read information from the data source to see how geographies change and how to account for the change.
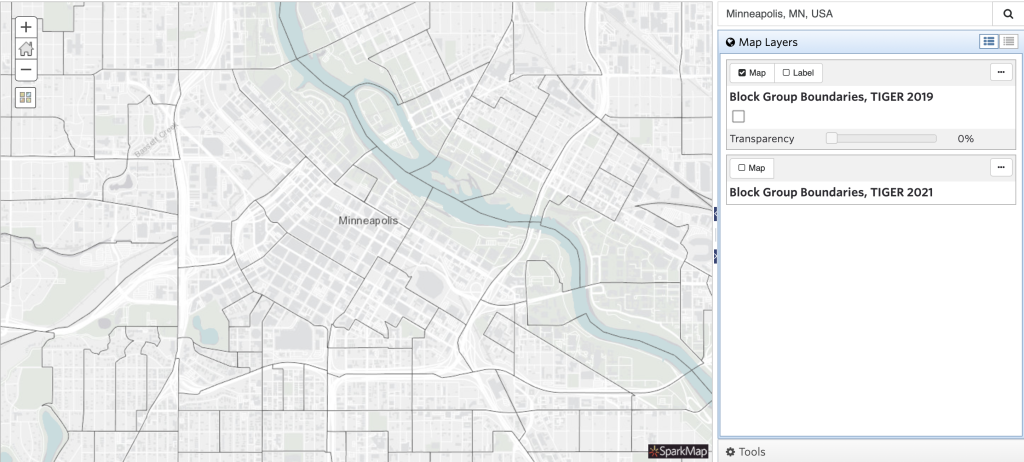
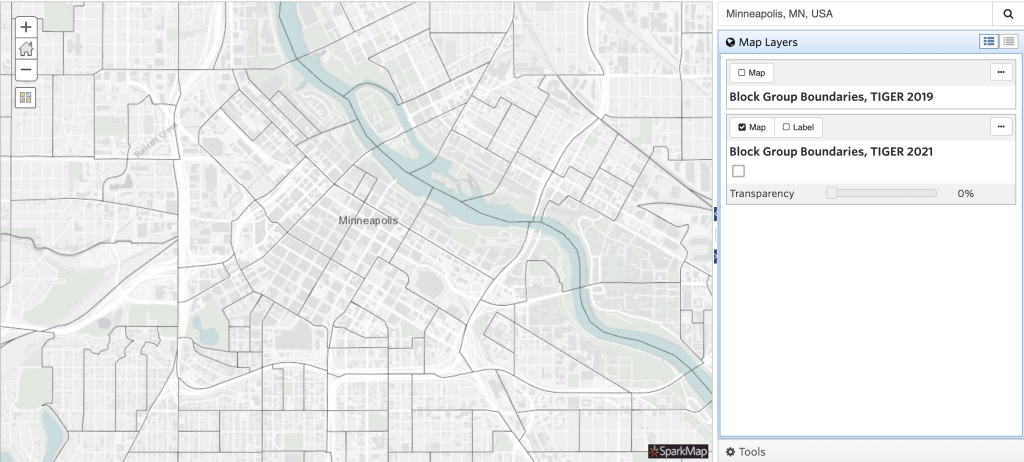
People may assume that geographies in the United States rarely change, since we don’t have new cities or states popping up all over the place. However, it is common for geographical boundaries like congressional districts, census tracts, block groups, and even ZIP codes to change at least once a decade following the decennial census.1 Boundary changes are important to note because if left unchecked, they can lead to incorrect comparisons. By visiting our Map Room, you can see how boundaries have been expanded, contracted, or absorbed due to population changes as shown in Figure 1. Therefore, we recommend always checking your data source to see which geographical vintage they are using. For additional documentation regarding boundary changes we recommend visiting the US Census Bureau website.
Changes in Data Collection
- Don’t plan on data collection methods and questions staying the same. Do expect response rates, questions asked, and methods for data collection to change.
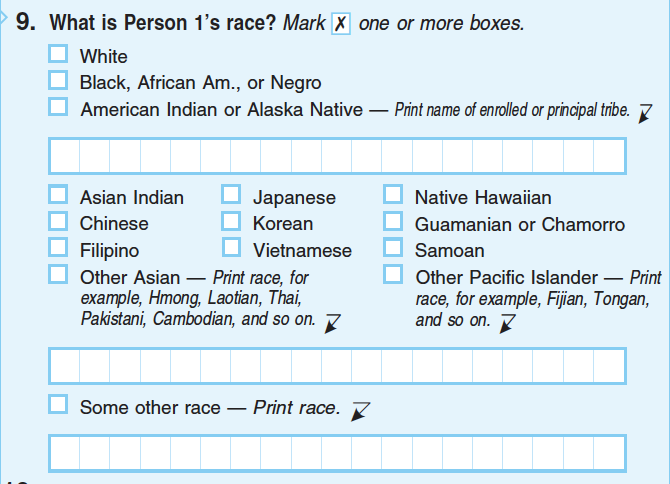
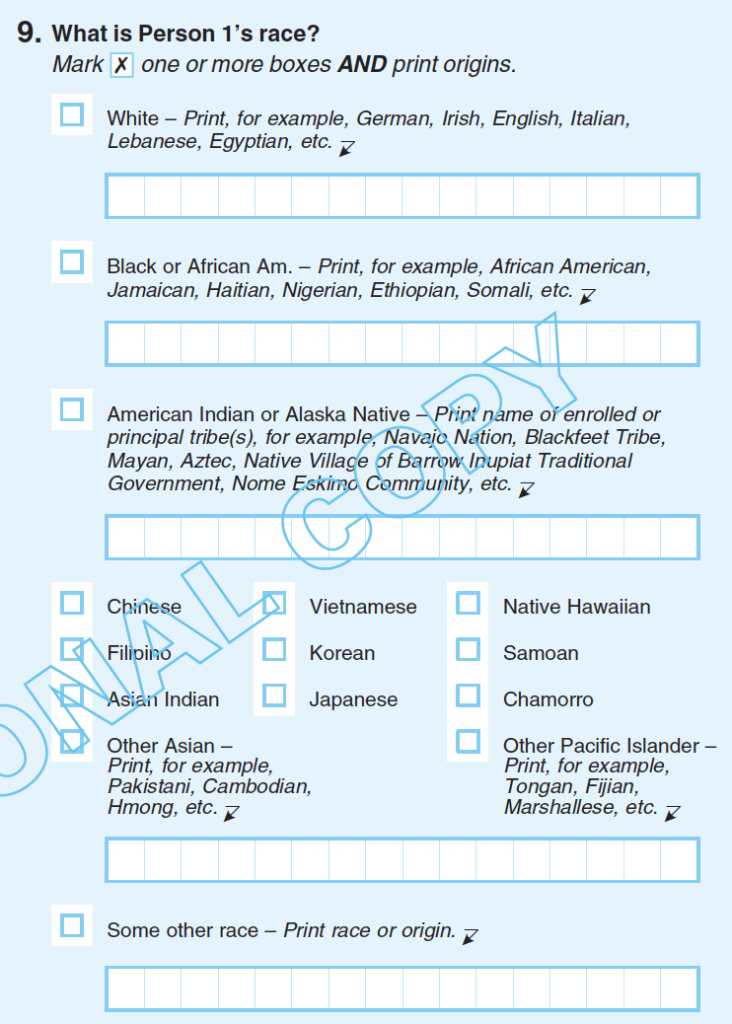
With large data sets like those collected by the US Census Bureau or Department of Transportation, it is not uncommon for data collection methods or questions asked to change as society changes. For example, the 2020 Census2 expanded the demographic questions and categories they asked about to better reflect how American’s identify themselves, leading to increased numbers of identification in the “Multiple Races” and “Some Other Race” categories (Figure 2). These changes are important to note when tracking data trends because you may notice groups discussed in some data sets and not others. It’s necessary to find information on and report these changes when you discuss data trends to accurately represent your findings.
Differences between Data Sources
- Don’t compare data from different sources, even if it’s on the same topic. Do use data from multiple sources to support your research.
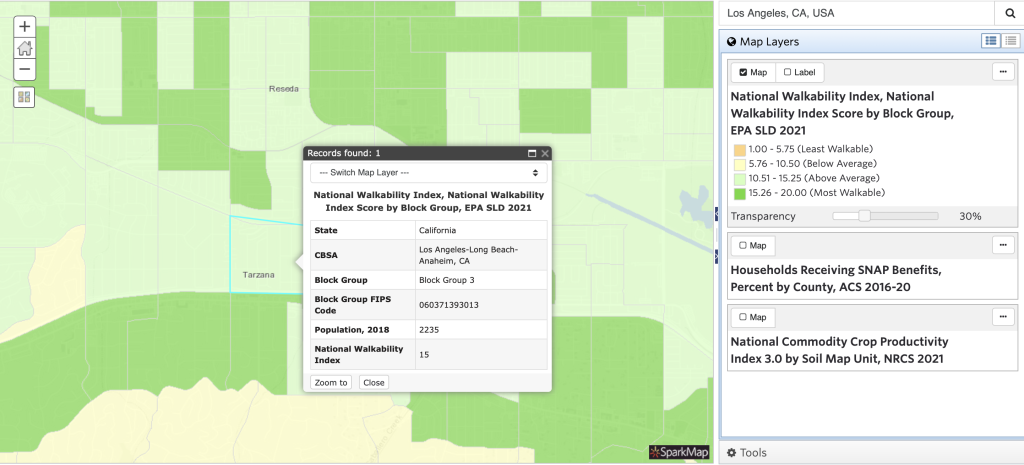
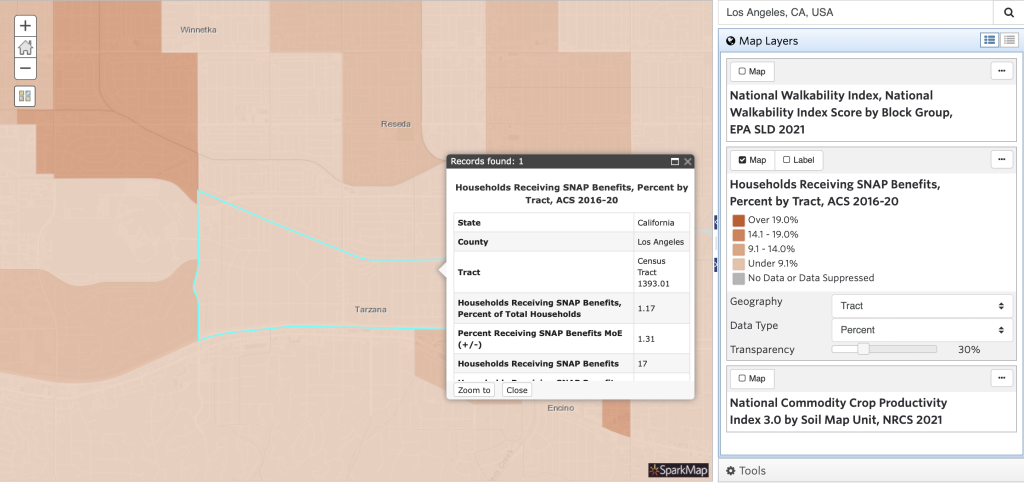
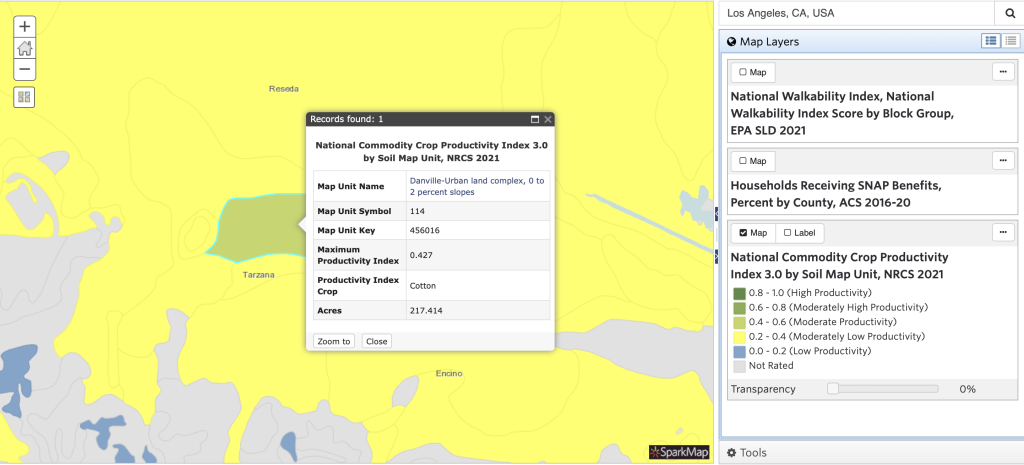
Comparing data with markedly different methodologies is rarely advised but compiling data from different sources to support your case can be a powerful strategy. Make sure you’re showing relevant data and not just data that supports your case. However, to tell a more powerful and compelling story, use date from multiple sources that support your argument. Let’s imagine you’re trying to persuade your city to buy a piece of land to develop a community garden. By using data from the National Crop and Commodity Production Index (NCCPI), Environmental Protection Agency, and American Community Survey, you can find a piece of land that is rated highly in crop productivity, is walkable within the community, and will benefit food insecure community members. Pulling from multiple data sets creates a much stronger argument for buying the property than comparing data from different sources all focusing on soil quality (Figure 3).
Overall, comparing data from more than one source is impactful but can be tricky. We recommend learning more information about the data sets you’re using to ensure accurate comparisons.