Conservation and Community Planning: Using Biodiversity, Water, and Soil Data
Incorporating conservation goals and data into community planning and assessments can be challenging. It can be equally difficult to find and interpret quality data related to conservation in a meaningful way. Adding to the complexity, conservation can also be a little ambiguous to define and may change depending on your goals. Are you conserving water? Soil? Natural communities? All of the above? How do these relate the communities in which we live and work?
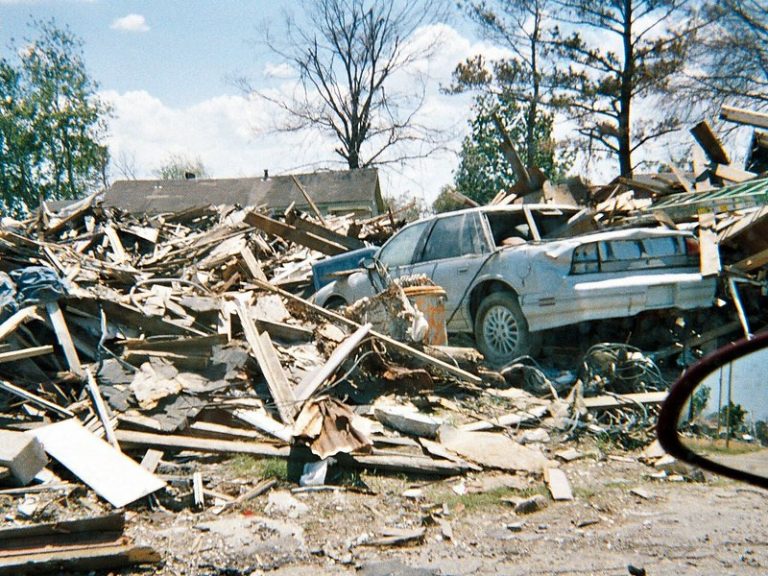
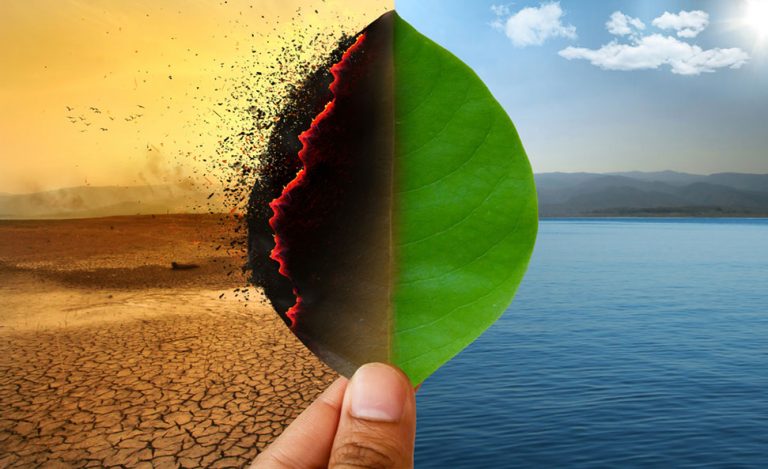
Humans have fundamentally altered the natural environment, driven by our need for food, water, shelter, and materials. In the process of meeting these needs, we have fragmented habitats, changed the makeup of natural communities, altered the composition and quantity of freshwater resources, and affected the air quality and climate of the environment in which we all live.1 All these changes impact our health, well-being, and quality of life. Biodiversity and natural areas not only support critical ecosystem services such as clean air and water but also have an important role in the physical and psychological health of humans.2
In this blog, we explore issues of conservation for economic and community developers, farmers, and agriculturalists to consider when undertaking projects. We will also highlight data related to endangered species, water, weather, and soil.
Endangered Species
In the United States, there are over 1,300 threatened and endangered species.3 These are plants and animals at risk of going extinct. Nearly all the decline of these species is due to human activities including land use changes, habitat fragmentation, and the introduction of chemicals and other pollutants into the environment. One famous example is the use of DDT in agriculture, which led to the decline of bald eagle populations and other birds of prey.4
Many different types of projects need to account for potential disruption of habitat to endangered or threatened species and prepare mitigation efforts accordingly. Additionally, farmers and ranchers may need to be aware of potential habitats on their land so they can take proper precautions when expanding agricultural activities. Data from the US Fish and Wildlife Service on SparkMap identifies threatened and endangered species and highlights critical habitat for some species (Figure 1). Note, specific location data is not made publicly available by Fish and Wildlife to prevent potential poaching of species.

The Map Room also includes layers such as pesticide use, mining activity, forest cover, soil types, and more—each of which can help provide a clearer, more comprehensive view of the broader environmental context affecting biodiversity and endangered species (Figure 2).

Water Use
For many people, when they hear the word ‘conservation,’ one of the first things they think of is water. This is in no small part because of public awareness campaigns around water conservation, especially in areas of the western United States where water rights and supply can be a charged subject. If you have spent time on the west coast, you’ve also probably heard about environmental movements to protect streams from being dammed for hydro-electric power to conserve habitat for species such as salmon. Even in areas where there is an abundance of water, there is still considerable concern over the quality of that water due to agricultural runoff of soil, pesticides, and fertilizer; the dumping of pollutants into water from industry; or health inspection failures of public water sources. Water free from contamination is crucial for all living things.
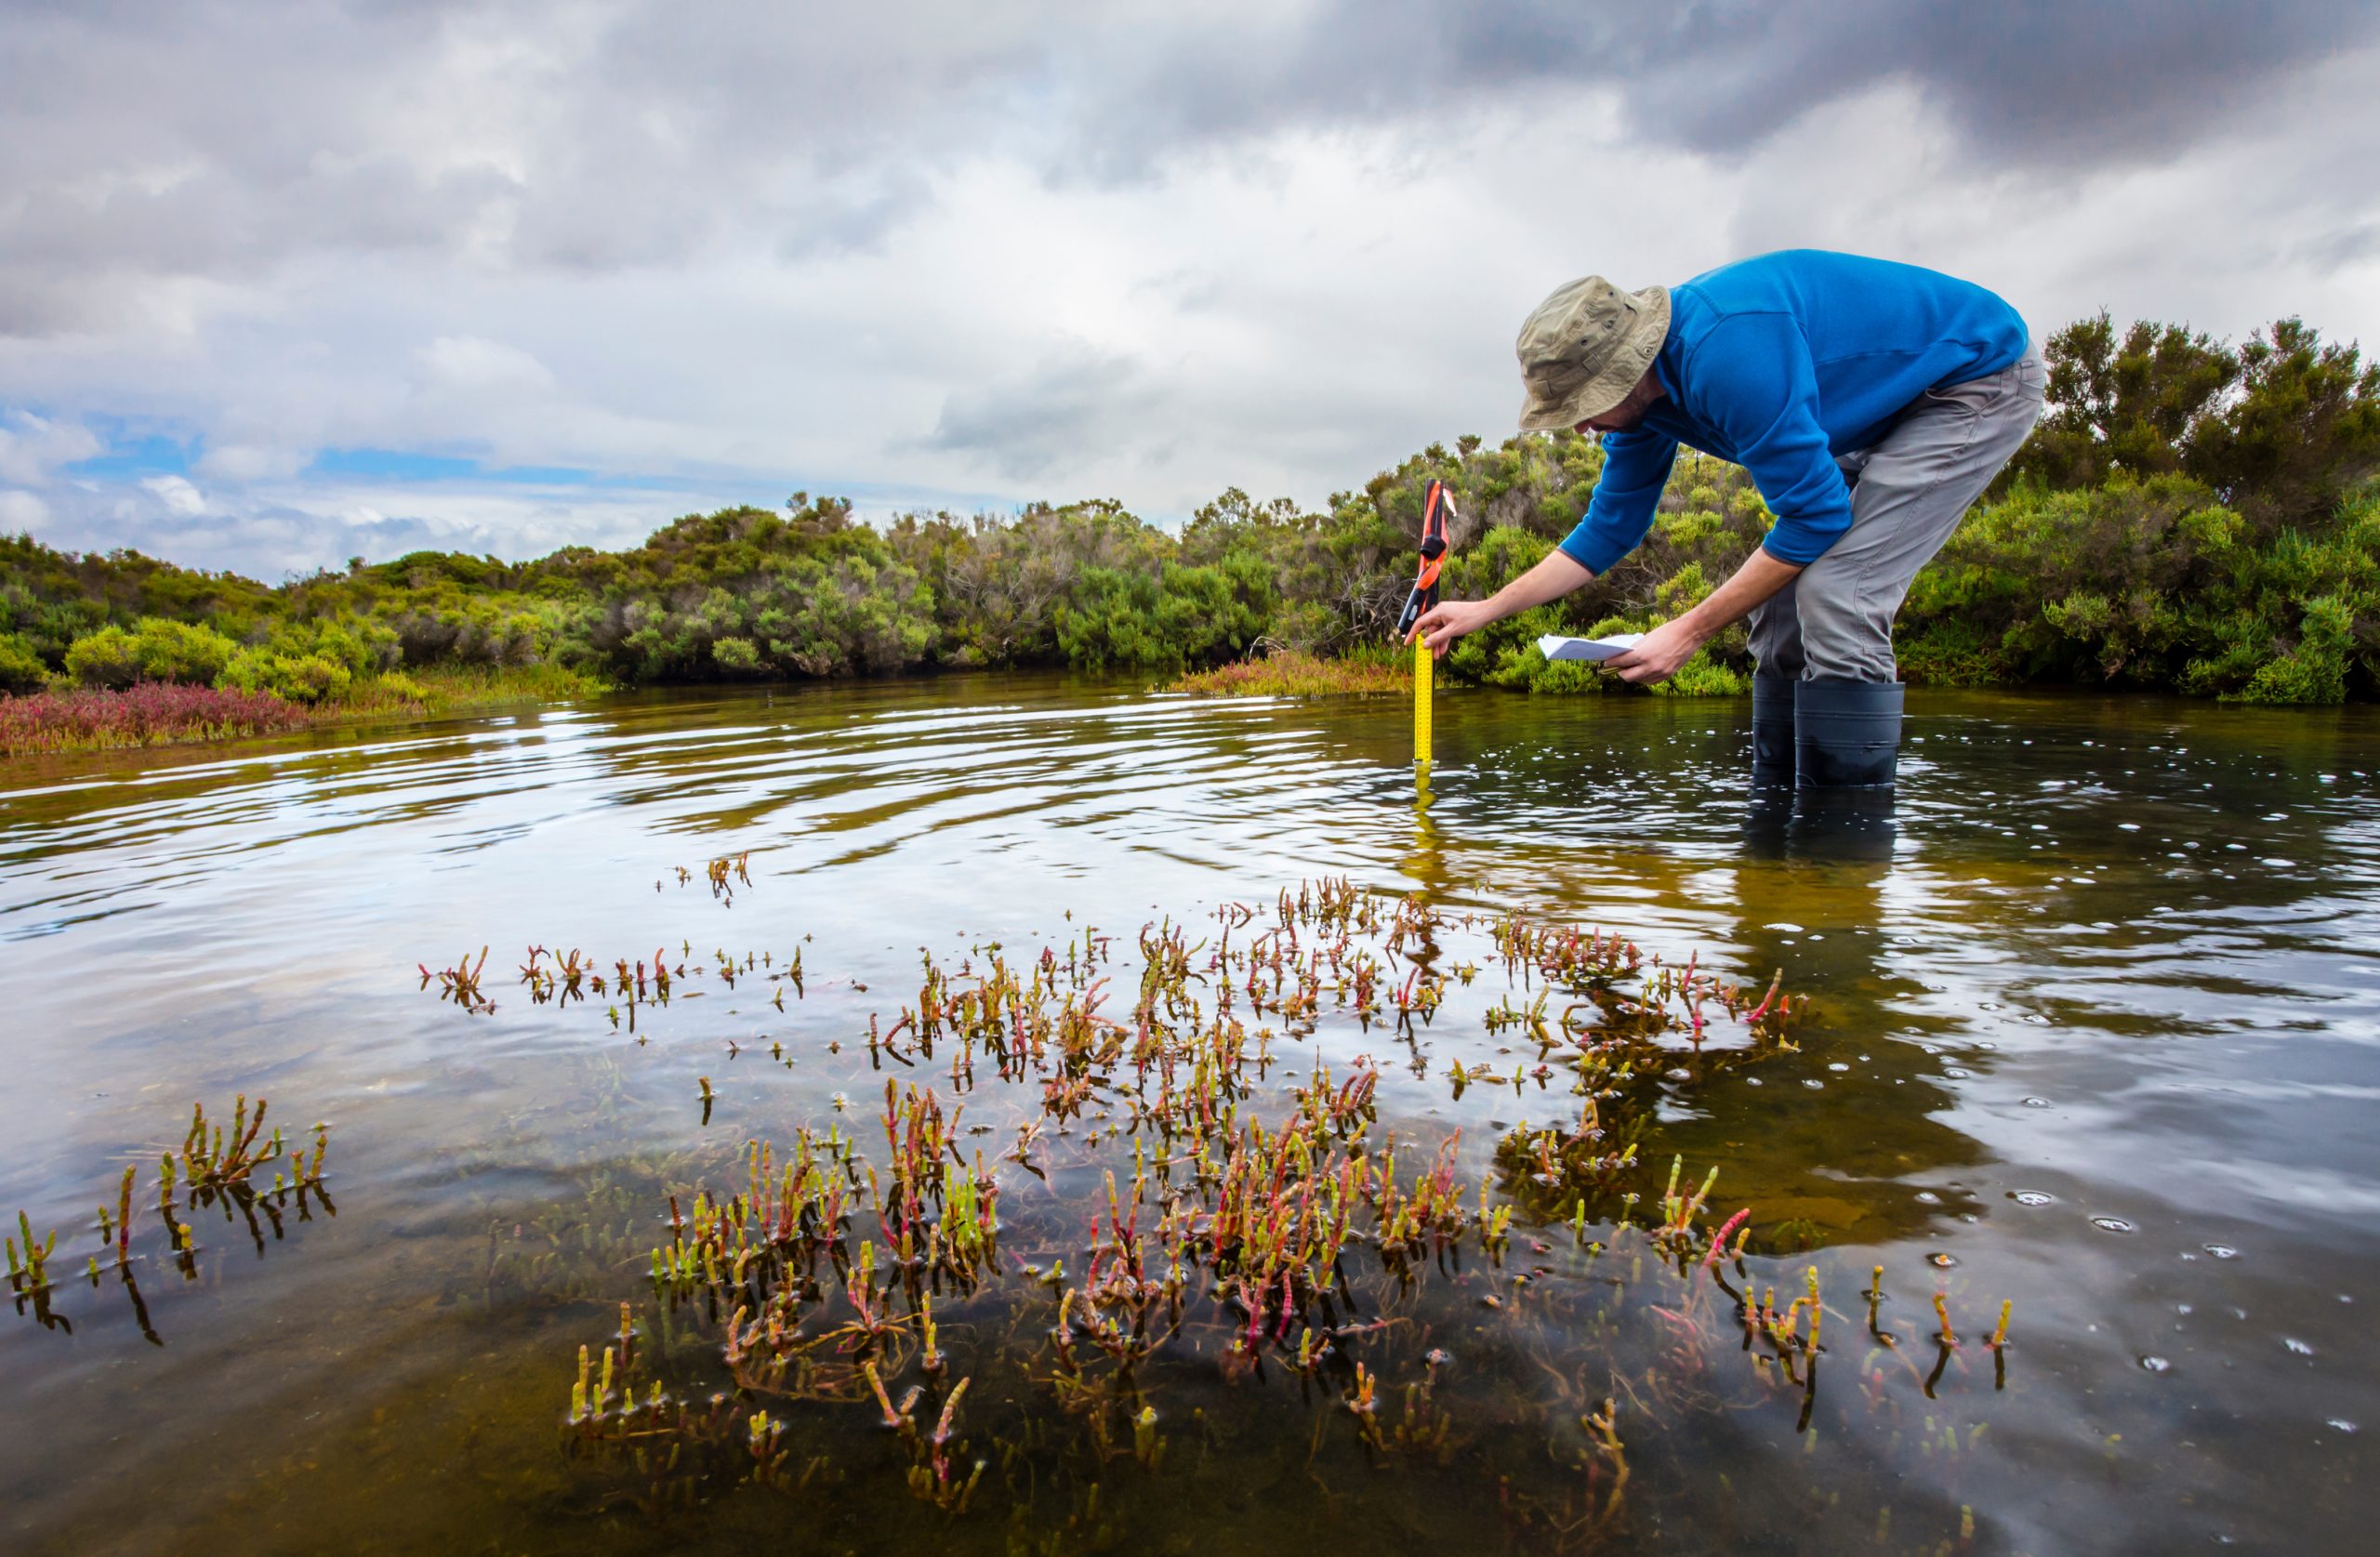
Human alteration of habitat through water withdrawal, the channelization of streams for irrigation, the dumping of pollutants, or the construction of dams, all play a role in the degradation of natural ecosystems. The United States Geological Survey (USGS) has several datasets around water use with more scheduled to be released in 2025. Current usage data is available in the SparkMap Community Needs Assessment as the Public Water Supply Usage and Irrigation Water Withdrawal indicators (Figure 3).

Note: Irrigation water withdrawal indicator is only available to Pro and Premium Subscribers.
Additional relevant map layers include water usage for thermos-electric power generation at the plant level, power plant locations and energy generation by primary fuel, water bottling locations, 303(d) impaired streams, toxic release inventory sites, and many more, all of which can be found for free in our Map Room by searching “water.”
Additional Layers
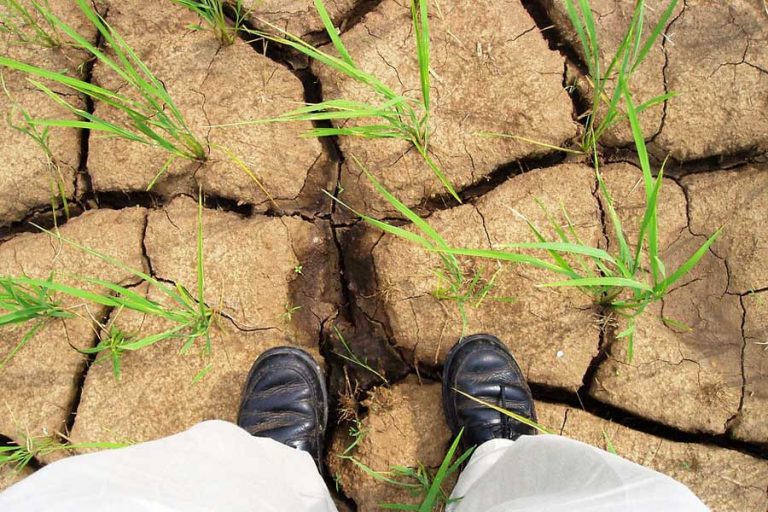
SparkMap hosts a variety of other layers that may be useful for planning around conservation objectives including land cover type from the National Land Cover Dataset, tree canopy coverage, park information including greenways and other open spaces from Trust for Public Land, drought from the US Drought Monitor, temperature and precipitation data from PRISM, heat data from Center for Disease Control, and many more! We are also committed to expanding our conservation and environmental data catalog. If you have suggestions for what kind of data would be useful for you, please reach out to the SparkMap team via our contact page.
References
- Jonathan A. Foley et al (2005). Global Consequences of Land Use. Science, 309,570-574.
- Sandifer, P. A., Sutton-Grier, A. E., & Ward, B. P. (2015). Exploring connections among nature, biodiversity, ecosystem services, and human health and well-being: Opportunities to enhance health and biodiversity conservation. Ecosystem services, 12, 1-15.
- Environmental Protection Agency. Learn more about Threatened and Endangered Species. Accessed May 20, 2025. https://www.epa.gov/endangered-species/learn-more-about-threatened-and-endangered-species
- Grier JW (1982) Ban of DDT and subsequent recovery of reproduction in bald eagles. Science 218:1232-1234.