Community Assessment 101
Picture your community. What are the demographics of your neighborhood? How many community members have attained at least a high school diploma? What does your built environment look like? Is there access to recreation and fitness facilities? Is there access to grocery stores in the area or is it a food desert?
Our Community Assessment tool allows you to answer these questions using high quality benchmarked data. Why is this important? Well, on a personal level it can help you get a better understanding of your community. On a broader level, though, our hope is that our Community Assessment tool provides those in healthcare, non-profit, and local governments with the data they need to make reports highlighting community needs and areas for improvement.
How to Use the Community Assessment
To help better understand your community’s assets and gaps, let’s create a Community Assessment in 6 easy steps!
1. Visit SparkMap.org! If you’re a subscriber, make sure you’re logged in to save your assessment and access all the indicators and benefits of your subscription plan. If you aren’t a subscriber yet, check out our pricing page with details of each subscription and our brand new assessment demos!
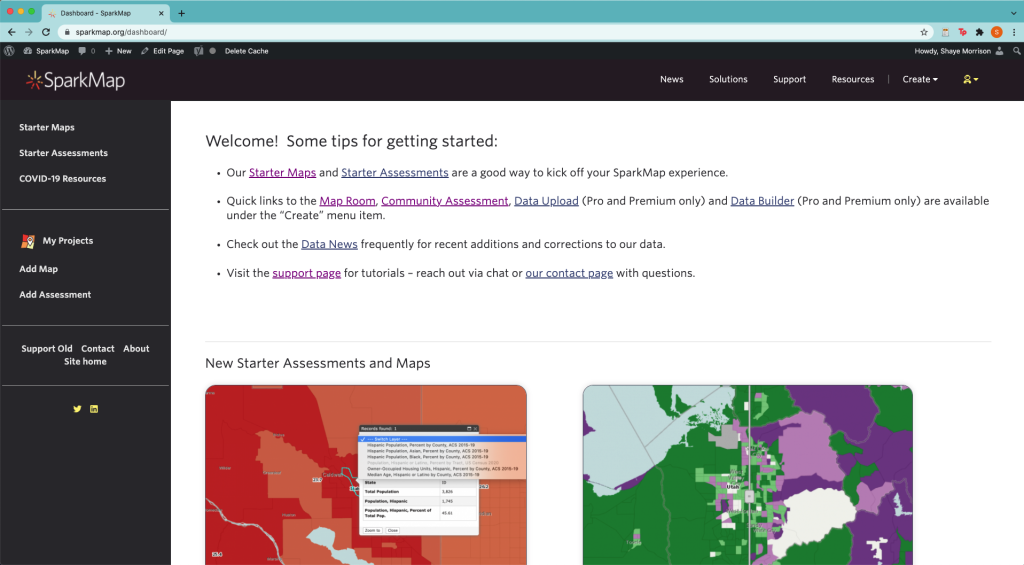
2. Navigate to the Community Assessment by hovering over the products button and selecting Community Assessment, or click here!
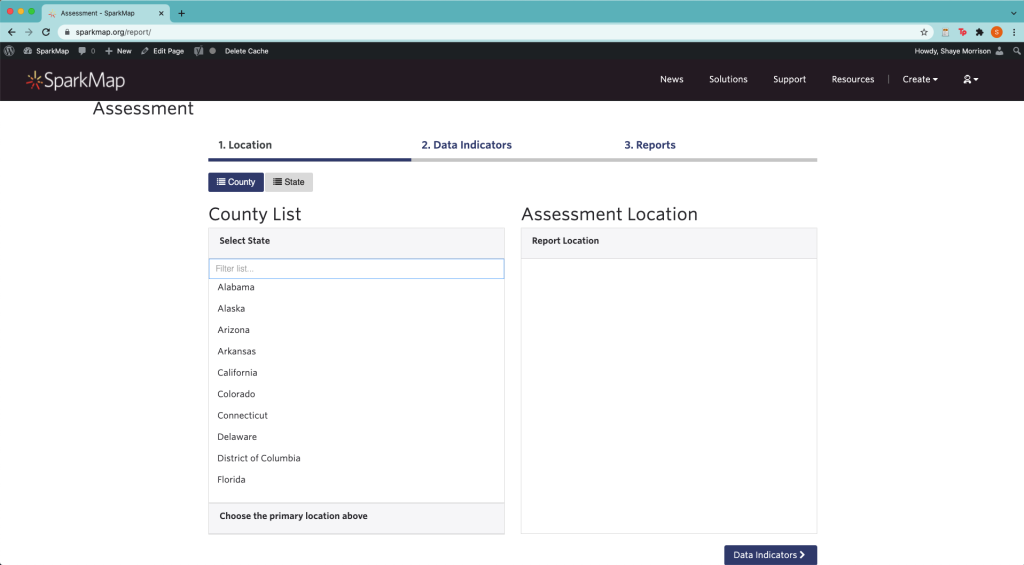
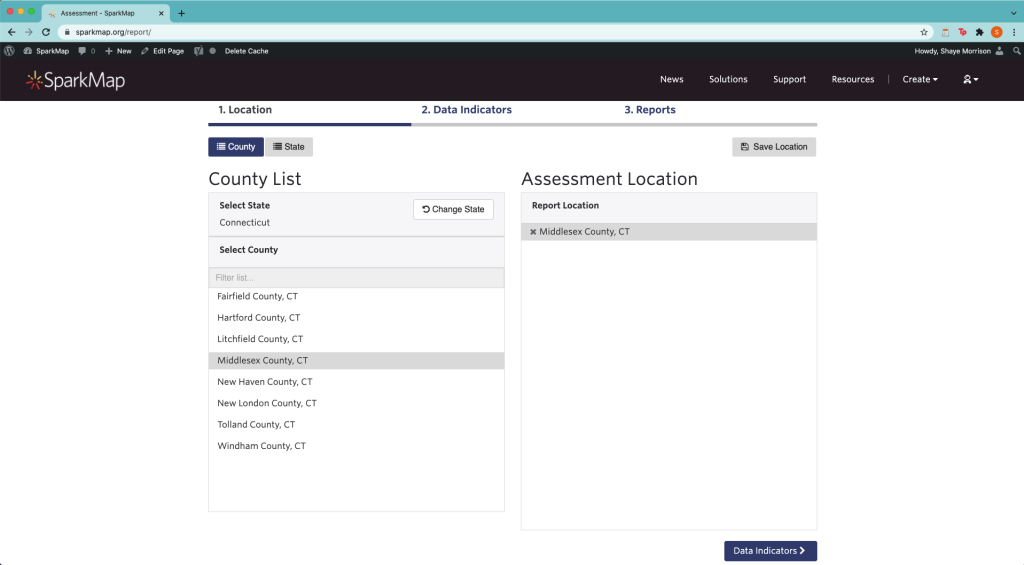
3. Start by choosing your location! First, select the state you’re interesting in building a report for. Once you select the state, you are able to select the county of interest. When you use the Community Assessment for free, you can build reports for one county with limited data indicators. By purchasing a subscription, you can build multicounty reports with access to increasing data indicators. Visit our pricing page for a full description of the differences between each subscription level.
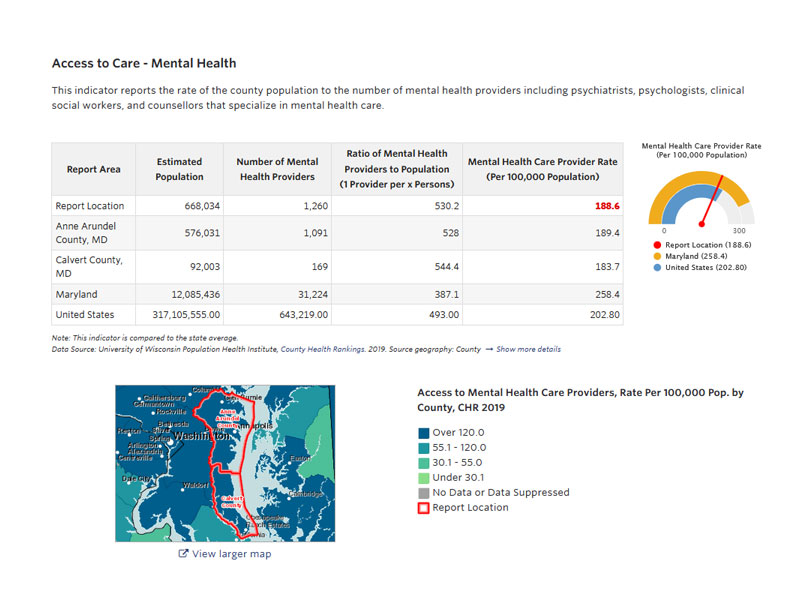
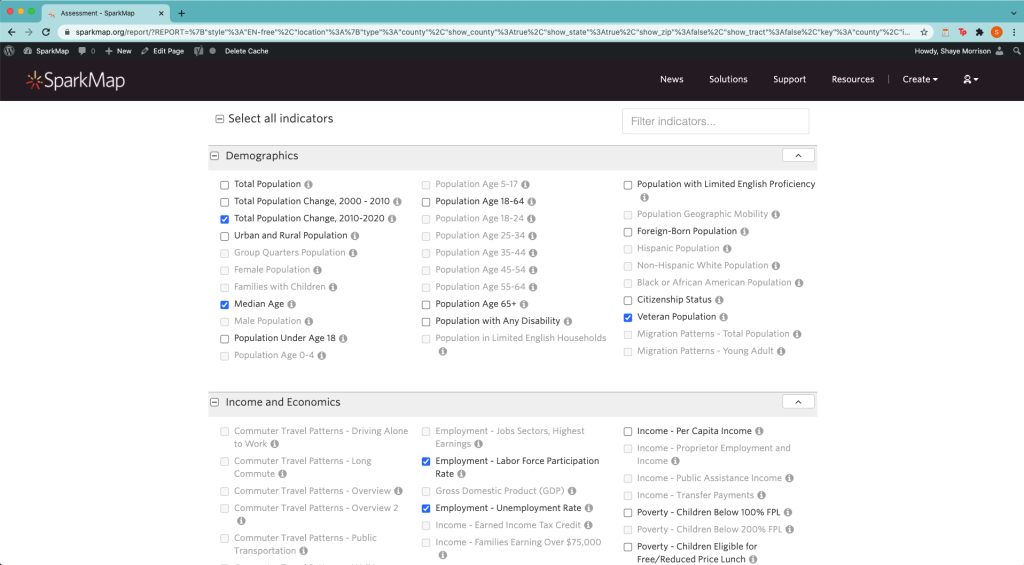
4. Choose your indicators! With a free SparkMap account you have access to over 80 indicators from high quality sources like the Census Bureau, CDC, and US Department of Labor. As you can see in the image below, some of the data indicators are grayed out—these indicators are included in our paid subscriptions. Once you’ve selected your indicators, select the blue “Reports” button in the bottom right corner. This could take a few moments as our tools are expertly gathering, describing, and visualizing the data for you!
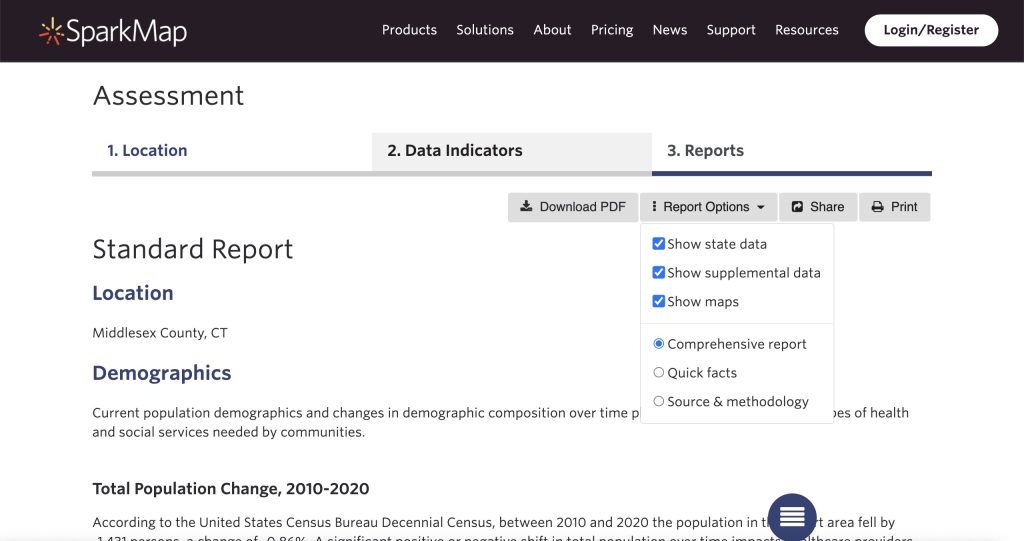
5. Navigate the report options. Once your report has loaded, we recommend clicking on the “Report Options” button in the top right corner. This will allow you to choose which information and visualization options are included in your report, change the type of report, and provide you with a list of information about the data sources.
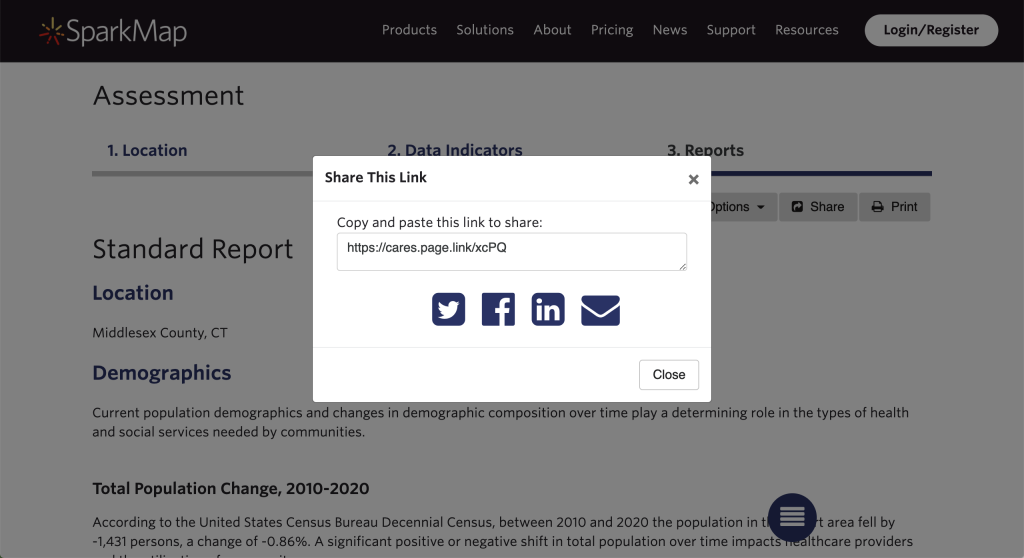
6. Download, share, or print your assessment! We want to make sure you can use your assessments, not just look at them! To save your assessment, be sure to create an account on SparkMap. Once you’re done adding indicators and perfecting your report download it as a PDF or share it to social media. Be sure to cite us so we can see all the amazing ways you use your reports!
Looking for more detailed instructions on building your own Community Assessment? Watch our video demonstration below!
You’ve created your report? Great! Now what?
Our goal in creating the Community Assessment tool was to provide you with the data needed for community improvement. We envision this being a simplified way to gather data needed for annual reports, business proposals, and local government meetings without sacrificing quality. Be sure to visit our Starter Assessment Gallery for more examples of the types of stories you can tell with our Community Assessment reports.
Looking Ahead
Next up in our SparkMap 101 series, we will be diving in to data visualization and explanation. We think our data really sets us apart. We’re excited to look deeper at some of the reasons why!