Skip to content
Ready to connect our data to your database? Learn about the SparkMap API!
SparkMap logo with red/yellow gradient starburst to left of text
  • API
  • CreateExpand
    • Community Needs Assessment
    • Map Room
    • Old Map Room
  • NewsExpand
    • Blog
    • Data News
    • Events
  • DataExpand
    • Data News
    • Community Needs Assessment Indicator List
    • Indicator Breakouts
    • Map Data List
  • IndustryExpand
    • Health
    • Non-Profits
    • Government
    • Use Cases
  • SupportExpand
    • Community Needs Assessment
    • Map Room
    • API
    • Glossary
    • Examples & Resources
  • Pricing
  • Login/Register
SparkMap logo with red/yellow gradient starburst to left of text

map room

Rainbow image of fruit and vegetables
Health | How To | Map Room

Where’s the Food? Part 1: Finding and Using Data on Food Retailer Locations

ByJordan Rhodes October 12, 2022June 7, 2023

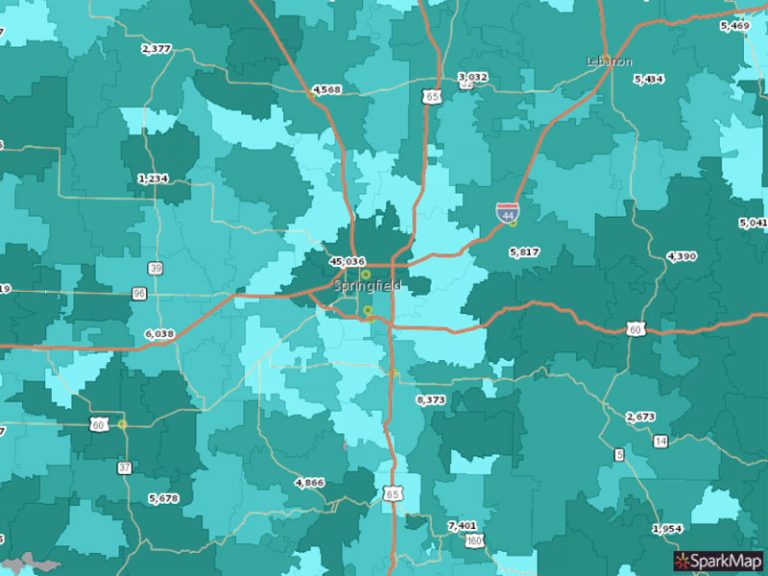
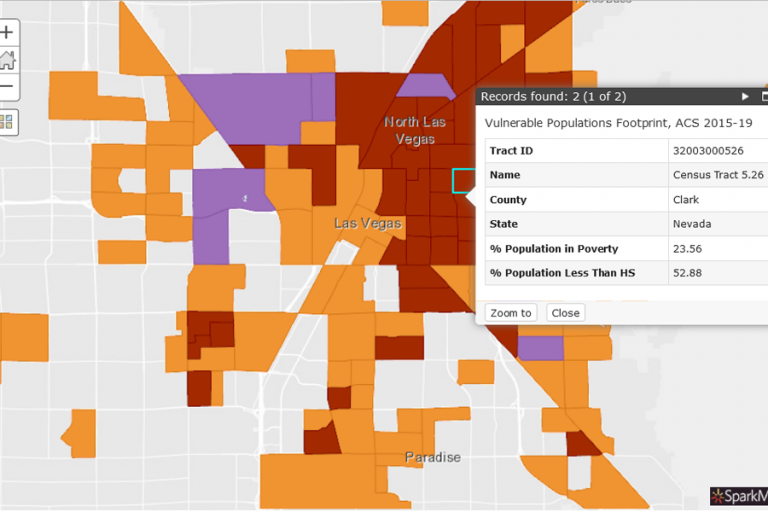
Whether you work in healthcare, community planning, or community improvement programs access to reliable food is a must. In this blog series we highlight different food layers available on SparkMap and how they can be used to benefit your community.

Read More Where’s the Food? Part 1: Finding and Using Data on Food Retailer LocationsContinue

Image of hand holding leaf with half burning in arid environment and half green with a body of water behind it
Data | Environment | Map Room

My World’s on Fire, How ‘Bout Yours?

ByShaye Morrison July 27, 2022June 7, 2023

In this blog, we highlight frequently updated wildfire and drought data layers. Whether or not your community is directly impacted by wildfire season or drought, our climate data can help you stay safe and spur positive community resilience.

Read More My World’s on Fire, How ‘Bout Yours?Continue

Young corn plants in field
Agriculture | Data

The National Commodity Crop Productivity Index (NCCPI)

ByMelissa De Bartolomeo June 22, 2022June 7, 2023

The NCCPI is a robust and valuable dataset – learn more about it and how to access it on SparkMap.

Read More The National Commodity Crop Productivity Index (NCCPI)Continue

image of drawn hearts
Health | Map Room

Heart Disease – Designing Community Interventions

ByMelissa De Bartolomeo February 14, 2022June 8, 2023

Heart disease is the leading cause of death in the United States. How can we use maps and data to understand where our most at-risk communities are and what interventions may help?

Read More Heart Disease – Designing Community InterventionsContinue

stack of pancakes
How To | Map Room

Building a Multi-Layer Map: Part One

ByJamie Kleinsorge January 25, 2022June 8, 2023

In this blog series, “Building a Multi-Layer Map” we will explore answers to core map-making questions, unpack some best practices, and highlight how you can use SparkMap to tell a story, rooted in data, about your community. 

Read More Building a Multi-Layer Map: Part OneContinue

block numbers changing from 2021 to 2022
Product Updates

A Year in Review: Looking Back & Gazing Ahead

ByShaye Morrison January 7, 2022June 8, 2023

In this blog we take a look back at all that you accomplished in 2021 and preview what’s to come in 2022. Thank you for being part of SparkMap. We can’t wait to see what you create this year!

Read More A Year in Review: Looking Back & Gazing AheadContinue

holiday tag with "to" and "from"
Data | Map Room | Special Topic

Hyperlocal data in the Map Room – looking for Nonprofits near me

ByMelissa De Bartolomeo December 9, 2021June 8, 2023

Learn how to use the Select Data tool in the Map Room to see data in context of a specific region or distance from a point. In this example, we’ll look at the data for 501(c)(3)s and (c)(4)s that are within 1 mile of an address.

Read More Hyperlocal data in the Map Room – looking for Nonprofits near meContinue

screenshot of map from Map Room
How To | Map Room

Map Room 101

ByShaye Morrison October 28, 2021June 8, 2023

Use the Map Room to tell the story of your community in a compelling and visually interesting way. Learn how to add data to a map and explore some basic ways to understand that data.

Read More Map Room 101Continue

vulnerable population tool screenshot
Economic | Education | Map Room

Explore the intersection of poverty and education: SparkMap’s Vulnerable Populations Footprint Tool

ByMelissa De Bartolomeo April 8, 2021June 8, 2023

Identify Vulnerable Populations with the SparkMap VPF Tool and help change health outcomes in the communities you care about.

Read More Explore the intersection of poverty and education: SparkMap’s Vulnerable Populations Footprint ToolContinue

Page navigation

Previous PagePrevious 1 2
SparkMap logo

a product of:

CARES - University of Missouri logo

ABOUT

DATA

PRIVACY POLICY/TERMS OF SERVICE

PRICING

SUPPORT

CONTACT

FOLLOW US

© 2025 Curators of the University of Missouri, all rights reserved, DMCA and other copyright information. University of Missouri Extension is an equal opportunity/access/affirmative action/pro-disabled and veteran employer.

  • API
  • Create
    • Community Needs Assessment
    • Map Room
    • Old Map Room
  • News
    • Blog
    • Data News
    • Events
  • Data
    • Data News
    • Community Needs Assessment Indicator List
    • Indicator Breakouts
    • Map Data List
  • Industry
    • Health
    • Non-Profits
    • Government
    • Use Cases
  • Support
    • Community Needs Assessment
    • Map Room
    • API
    • Glossary
    • Examples & Resources
  • Pricing
  • Login/Register