Heart Disease – Designing Community Interventions
Heart disease is the leading cause of death in the United States. How can we use maps and data to understand where our most at-risk communities are and what interventions may help?
SparkMap may experience intermittent outages from 8 pm CT July 26 - 12 pm CT July 27 for site maintenance. We recommend saving frequently during this time.


Heart disease is the leading cause of death in the United States. How can we use maps and data to understand where our most at-risk communities are and what interventions may help?

In this blog we take a look back at all that you accomplished in 2021 and preview what’s to come in 2022. Thank you for being part of SparkMap. We can’t wait to see what you create this year!

On August 12, the U.S. Census Bureau released the most comprehensive set of data yet from the 2020 census. Demographic data was released at the “census block” level, which is the smallest unit of geography the census defines for public use (see below resource for more information) .
For the first time ever, SparkMap is offering ZIP code breakouts for nearly 100 of our indicators. Get data for every ZIP code in your assessment area – view alongside our dynamic data visualizations or download for offline use.
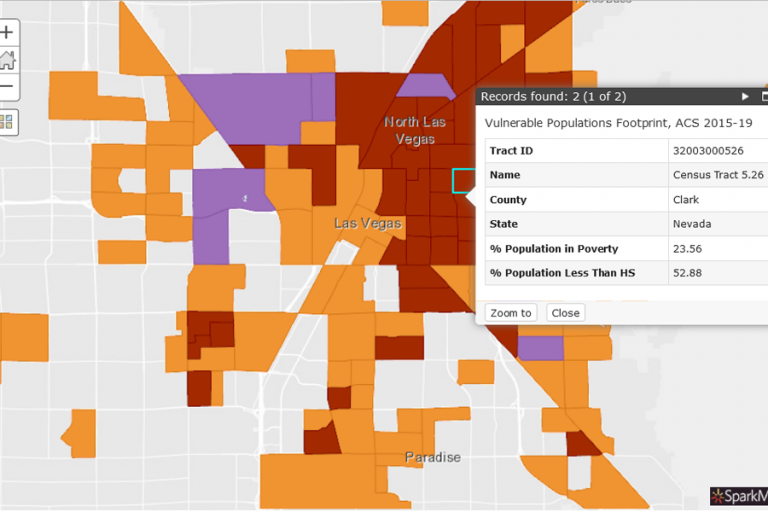
Identify Vulnerable Populations with the SparkMap VPF Tool and help change health outcomes in the communities you care about.

Are you focused on expanding, understanding, or analyzing women’s opportunities in the economic sector, do you want to support the implementation of gender-focus policies in the US or at the local level? Learn about how you can access sex-aggregated data on this week’s blog in honor of Women’s History Month.

If you’ve existed in the health space for any period of time, you’ve probably heard of BRFSS data, but what is it, really?
Learn more about the importance of the Behavioral Risk Factor Surveillance System.