
Data Dive: Social Security Beneficiaries
As of April 2026, 71,077,000 people have received social security benefits totaling $137,377,000.1 With such a vast number of individuals relying on the payments each month, it is important to better understand who is receiving benefits and how much they are receiving.
Data on social security is relevant to us all at an individual, governmental, and economic level. Individually, understanding benefits can help with financial and retirement planning. On a governmental level, it is important information for policymaking. At the economic level, understanding the status of social security can provide indicators of national financial health and help forecast future expenses. In this blog, answer the following questions about Old-Age, Survivors, and Disability benefits data on SparkMap:
What do the data describe?
What do these data tell me?
Where can I access the data?
Where can I find more information?
What do the data describe?
Old-Age, Survivors, and Disability Insurance benefits data are sourced from the Social Security Administration. The data are updated on an annual basis, with the most recent data reflecting 2024.
What does the social security data tell me?
These data provide two overarching sources of information: the number of individuals receiving social security benefits and the total amount of benefits dispersed.
When it comes to those receiving social security benefits, there are a few different data points available. First, you can find data by type of beneficiary, including All Beneficiaries, Disabled Workers, Retired Workers, and Recipients Aged 65+. Second, you can access data by geography type, either county or ZCTA. Lastly, you can visualize data based on data type, either percent or total.
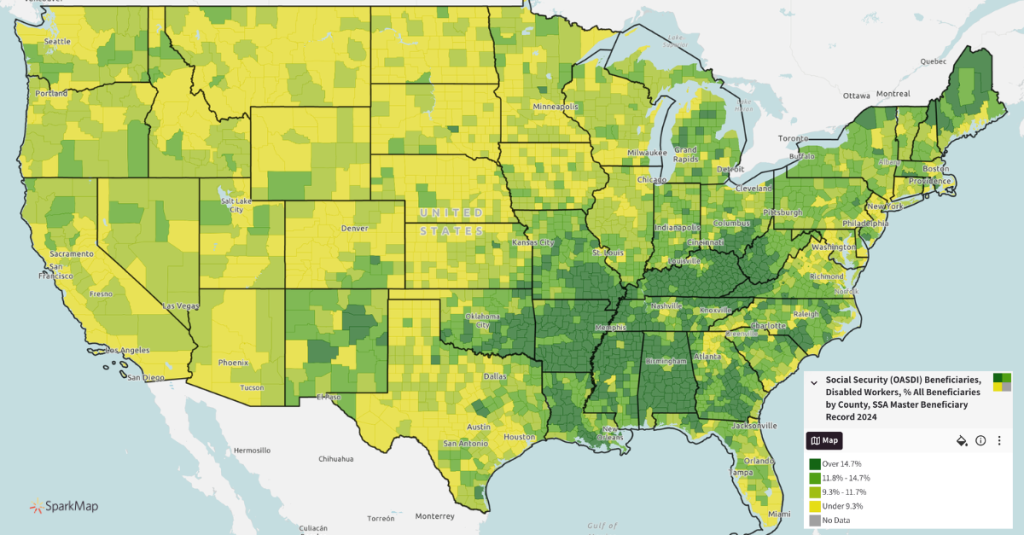
Figure 1 shows the percent of disabled workers by county. By clicking the map, you’re able to see the percent of disabled workers within the county who receive social security benefits. The data can be interpreted the same way regardless of data type, geography, or beneficiary.
In addition to providing information on who is receiving social security benefits, data on how much money is dispersed for social security each month is available. For this information, there are also three data points available. First, you can find data on Retired Workers or All Beneficiaries. Second, access the data at both the county and ZCTA geography levels. Lastly, you can see the average monthly disbursement per recipient, or the total dollars spent on social security each month.
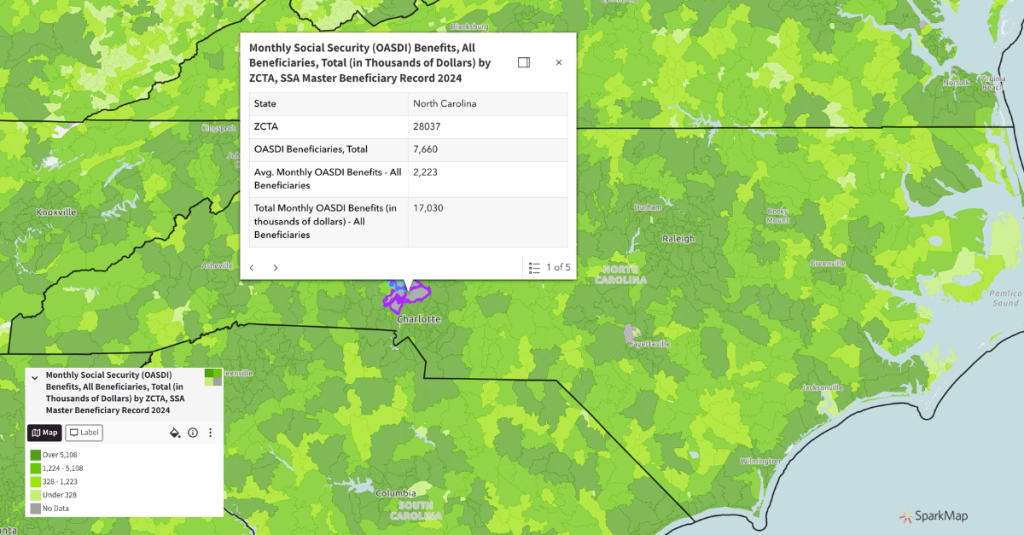
Figure two shows the total monthly dollars disbursed to all social security beneficiaries for ZIP Code 28037 in North Carolina. By clicking on the map, or turning on the labels, you can see that total monthly benefits in the ZIP code are $17,030,000. It is important to note, if you are looking at total monthly benefits the number presented is in the thousands (i.e., $17,030 in the pop up should be interpreted as $17,030,000).
Where can I access the data?
Access all OASDI Beneficiaries data for free in the SparkMap Map Room. To find all available layers, either search by key phrase “Social Security” or search by source “Social Security Administration.”
Where can I find more information on social security?
- https://www.ssa.gov/policy/docs/ssb/v69n1/v69n1p75.html
- https://www.ssa.gov/OACT/FACTS/
- https://www.ssa.gov/policy/about/oasdi-reference.html