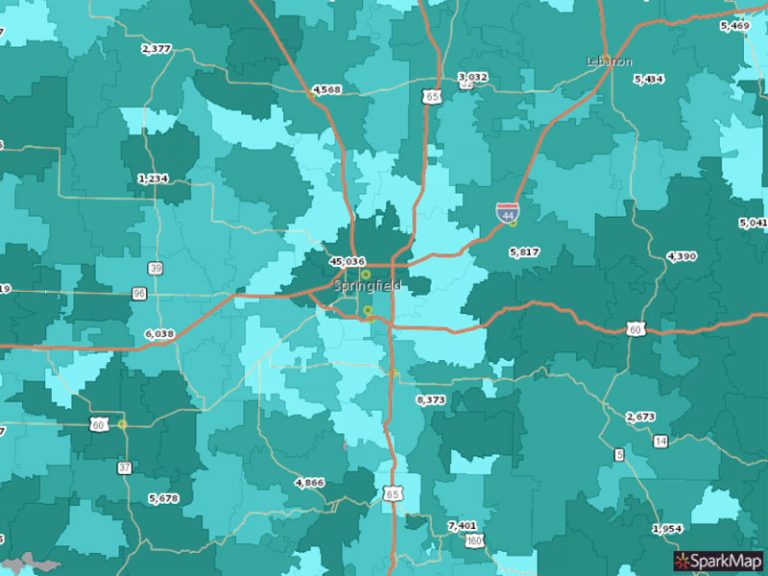
Hyperlocal data in the Map Room – looking for Nonprofits near me
Learn how to use the Select Data tool in the Map Room to see data in context of a specific region or distance from a point. In this example, we’ll look at the data for 501(c)(3)s and (c)(4)s that are within 1 mile of an address.