Selecting Data for a CHNA: Five Best Practices
Community Health Needs Assessments (CHNAs) have evolved in many ways over the last ten years. New data, new social determinants, new frameworks, and new requirements – these factors and more have caused tremendous change in the processes used to build and evaluate health assessments.
Here are 5 best practices we’ve learned along the way when it comes to selecting data for your CHNA:
1. Be aware of data recency and release cycles and limit the use of untimely data.
Use regularly updata and released data in your CHNA. Good examples of regularly updated data include indicators like the percent of population living in poverty, unemployment rates, and health insurance status. These data have predictable publishing cycles and do not leave long gaps between releases. Examples of data to use with consideration include transit availability, indices like the modified food retail environment, and FBI-reported crime rates. These data are less predictable and/or updated less frequently. Including them in your CHNA is still appropriate but showing impact or trends over time will be more challenging.

–> Stay on top of data updates and release cycles – use the SparkMap What’s New feed to stay in-the-know.
2. Select a core set of indicators that have trends for the last 5-10 years in your CHNA.
By selecting indicators that are released regularly and frequently, you are also building a core set of indicators that have trends – after all, consistent collection and release cycles are central to producing valid and measurable trends. These trends will help to identify whether your services, interventions, and strategies are having an impact on health outcomes in your service area. For example, access to primary care is collected annually and comparable over time. Primary care doctor recruitment and retention strategies can be visualized within the data and evaluated with greater accuracy.

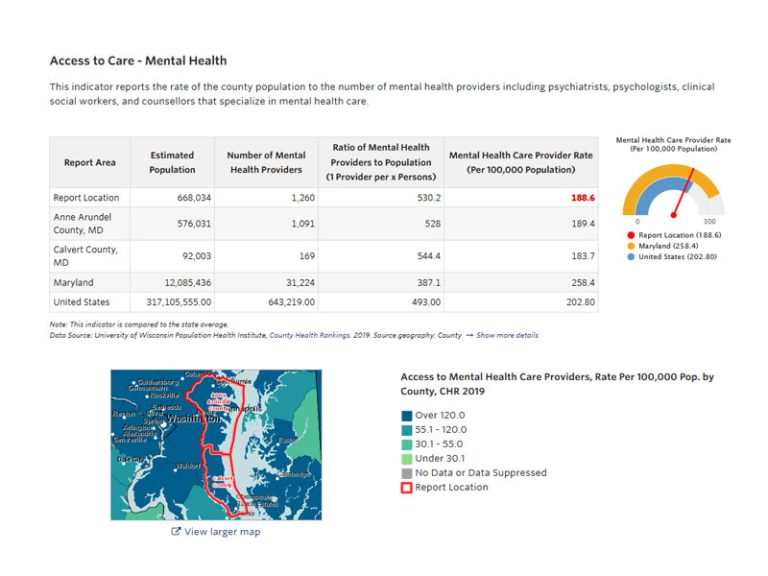
3. Prioritize indicators with race, ethnicity, gender, and age breakouts.
In a perfect world, all indicators would provide demographic breakouts and allow you to easily filter data by characteristics like race, ethnicity, gender, age, and socioeconomic status. Unfortunately, demographic breakouts are not ubiquitous across common CHNA indicators and addressing issues related to equity is more difficult without them. Of note, data from the US Census Bureau often includes multiple types of breakout options. If you’re looking to see if a specific indicator has breakouts, explore our filterable Indicator Breakouts list.

4. Use locally sourced data in your CHNA, if and where available.
For example, data like the number of licensed childcare facilities or prevalence rates for STI’s are indicators that are often available via state or county departments of health. Crime rates, transit availability, and point-in-time homeless counts are also examples of data that can be more representative of local conditions by being sourced locally.
–> SparkMap Premium Subscriptions provide an Export to Word option. This features makes pulling together local data and secondary data into one assessment quicker and easier.
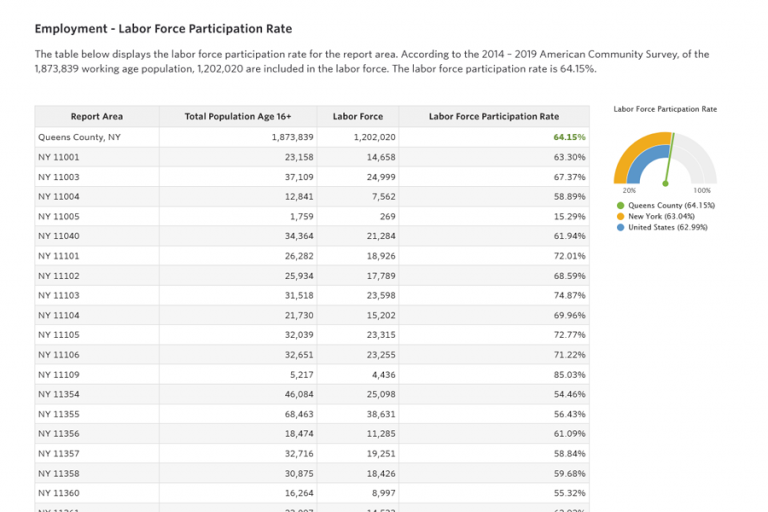
5. Match your data geography to your service area geography, where possible.
While county level data is great, many hospitals and health service regions don’t serve an entire county, or they serve a county plus a nearby metropolitan area. You’re likely missing part of the picture by using county-level data and may not be able to suss out issues related to equity that are hidden at a larger geography. Luckily, more and more indicators are becoming available at the ZIP code, Census Tract, and city-levels. Using these smaller geographies to drill down into the data can facilitate more meaningful prioritization, more targeted strategies, and greater health impacts.

–> SparkMap Premium Annual Subscriptions give you the flexibility to create your own service area and build a custom assessment that includes both county-level and ZIP-level data.
Overall, picking the right indicators is central to any health needs assessment process. Secondary data drives prioritization, strategy development, and how you view your impact. What are your best practices for selecting health assessment indicators? Let us know on LinkedIn and Facebook!