Understanding Access to Mental Health Resources
Blog Objectives: Load, upload, and explore existing and new data to understand mental health access
Users will be able to:
- Select, compare, and analyze layers
- Upload unique data in the map (Pro and Premium)
- Discover mapping features such as the symbology and measure tool
Good mental health is important at every stage of people’s lives. From childhood and adolescence, through adulthood and beyond, being emotionally healthy promotes productivity and effectiveness at work, in school, and in caregiving. Concerns about poor mental health, however, are rapidly growing due to COVID-19 and its consequences, such as economic instability, social isolation, and increased substance abuse [1]. In order to maintain positive, long-term mental health outcomes in communities around the nation, organizations and governments need access to up-to-date, reliable, and accurate data to effectively allocate resources, programs, and training opportunities for those who need it most.
The Substance Abuse and Mental Health Services Administration (SAMHSA) initially provided $825 million in March 2021 and $3 billion in May 2021 for community mental health services in all states and territories of the United States [2]. The goal of the funding is to address the needs and gaps of existing mental health treatment services. In order to identify communities that could benefit from such funding or similar ones, we prepared a quick guide on how to not only use existing data, but also how to upload and analyze your own data in SparkMap.
Utilizing SparkMap Data
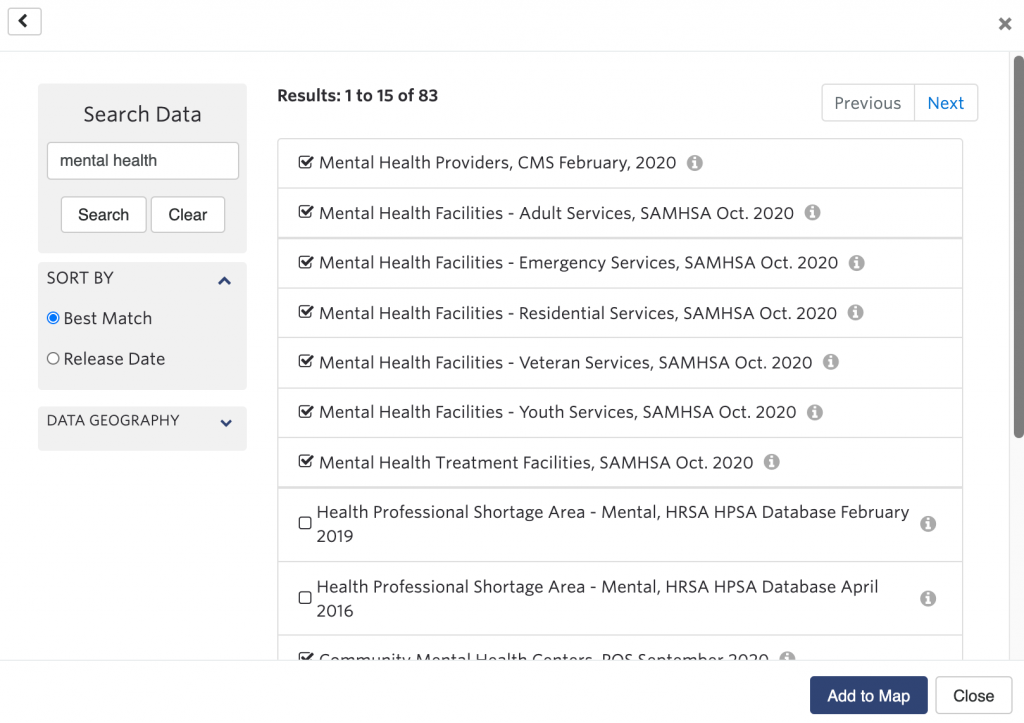
With over 30,000 layers in SparkMap, you can access relevant data to fit your needs, such as locations of mental health facilities focused on assisting adults, youth, veterans, and other communities (Figure 1). Additionally, with more than 200 indicators in our Community Assessment you can further discover issues of access to mental health resources in a specific area.
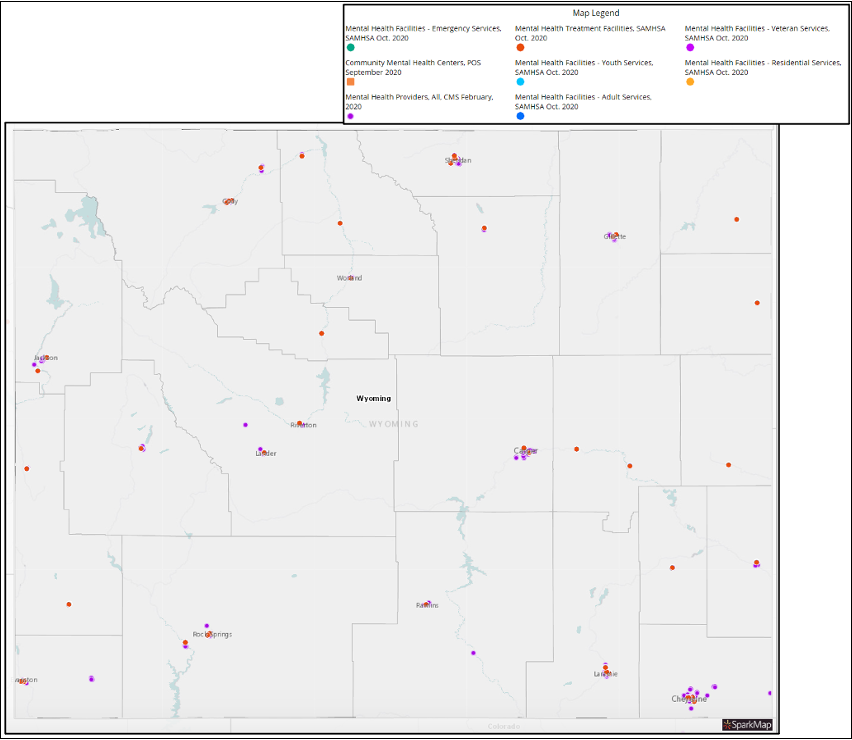
Let’s take our SAMHSA funding example from above and explore which counties in the state of Wyoming show the most need of mental health funding. After searching the key words “Mental Health” and loading various layers of “Mental Health Facilities,” the final map in Figure 2 shows points representing the mental health facilities in the area [3]. At a glance, all the counties have facilities focusing on mental health, varying in location and the groups being served. However, if we include a second map layer that ranks the counties based on “Access to Mental Health Care Providers,” then we can identify which counties have a low number of providers available to serve the total population of that county.
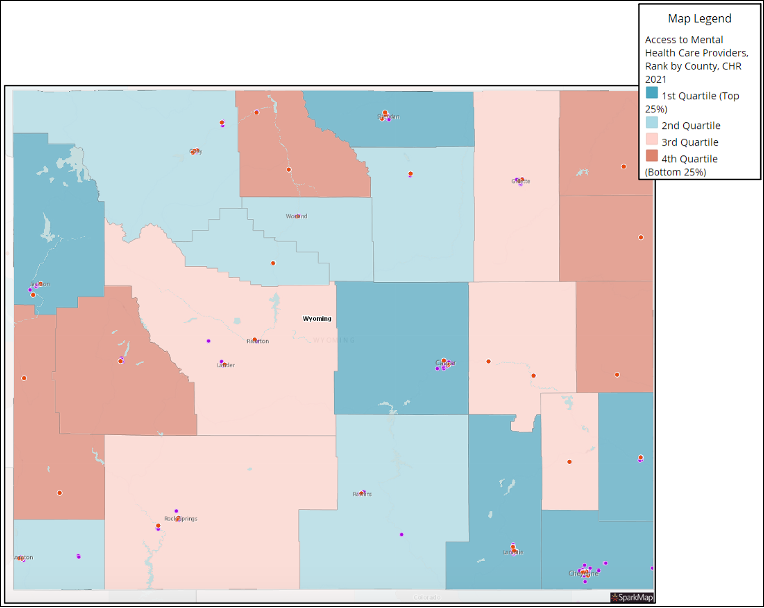
For example, Figure 3 shows counties in the northeast side of the state with low access to mental health providers as they are ranked in the 4th quantile. Thus, while the points representing facilities show the type of services offered in the county, the ranking map layer identifies which counties have a limited number of facilities to serve their entire population. This can guide the level of funding and which services are still needed.
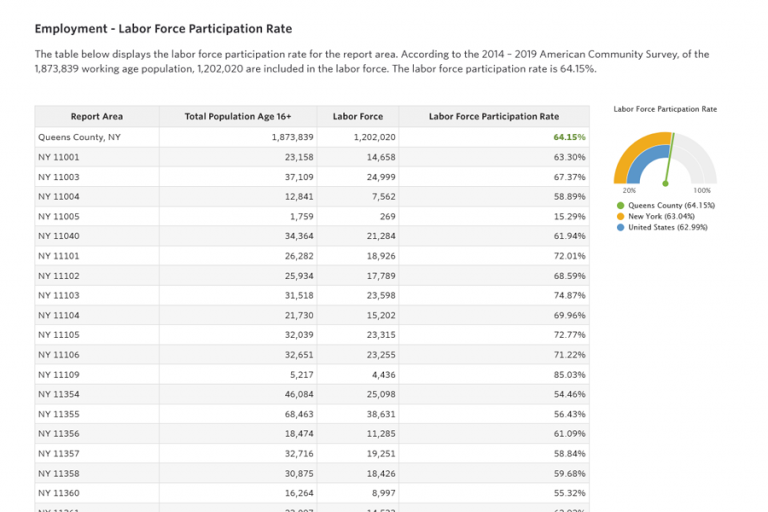
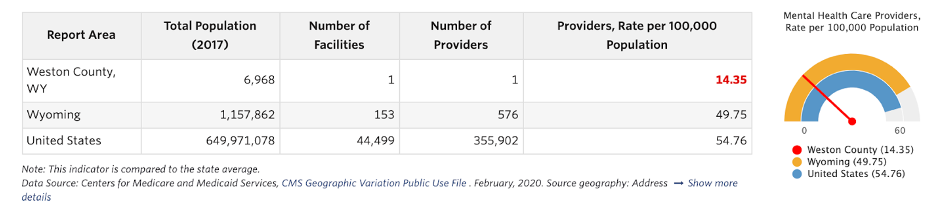
Finally, after identifying the counties of interest, we can create a Community Assessment of those counties, which can further contextualize access to mental health resources as the assessment compares the county to state and national levels, as shown in Table 1 [4].
Uploading and Manipulating Your Own Data (Pro and Premium)
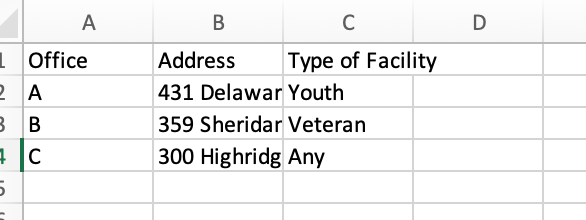
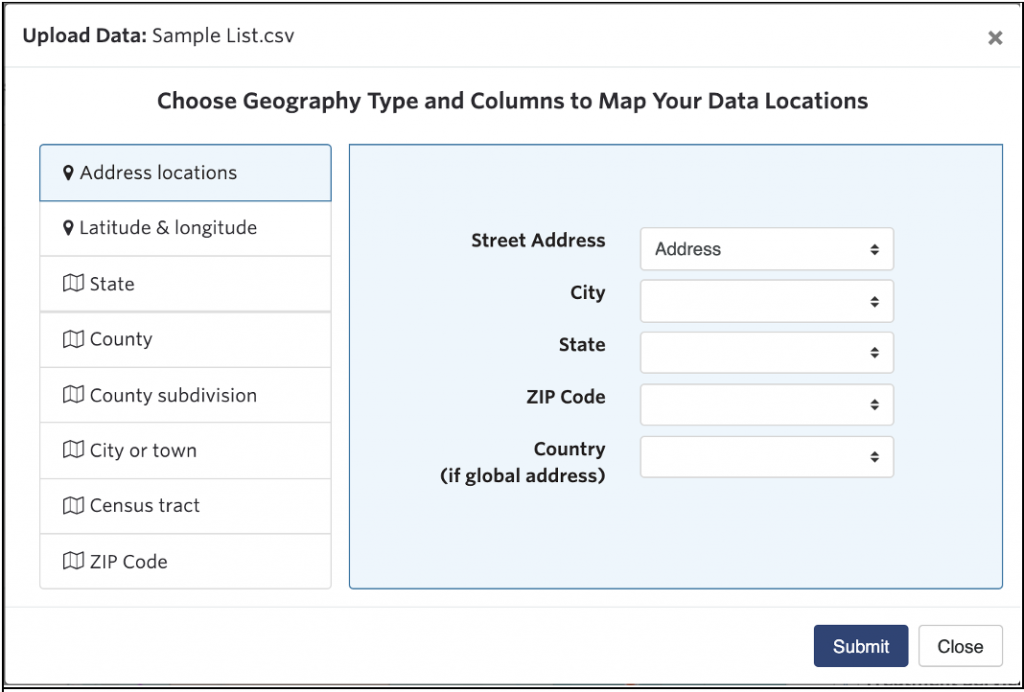
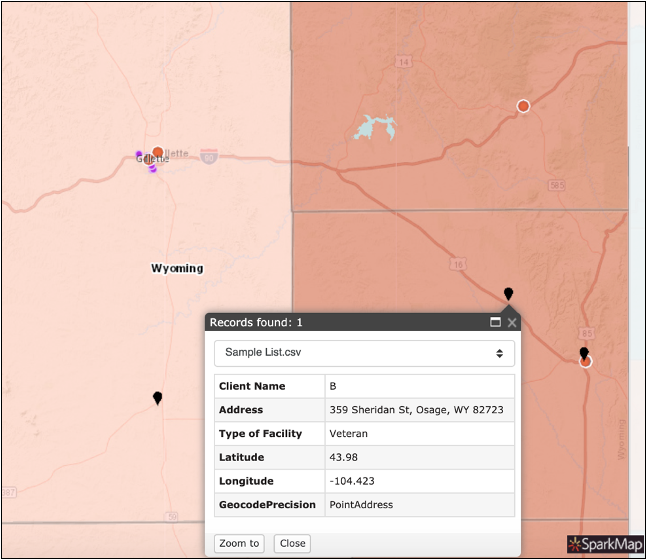
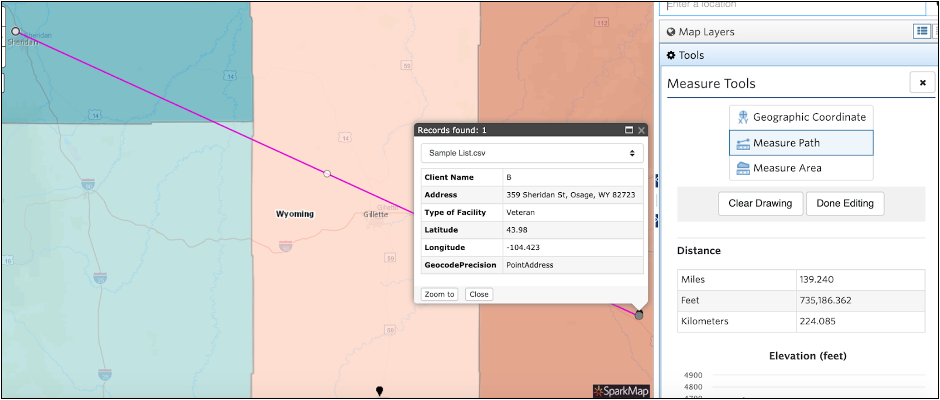
One of the perks of a Pro or Premium subscription is the ability to upload your own data in the form of CSV, KML/KMZ, or shapefiles [5]. You can combine our secondary data with any point or polygon data of your choosing. For example, Table 2 shows a CSV table with addresses of three fictional mental health offices in northeast Wyoming. The use of tools like Upload in SparkMap helps determine if the private offices serve populations that are not served by other mental health care facilities. When the CSV table was uploaded into SparkMap (Figure 4), the system recognized addresses and converted them to points, in this case black markers in the map as shown on Figure 5. To analyze the distance between mental health providers and the list of offices, we used the “Measure Tool” as shown on Figure 6. As we can see, that the area surrounding Office B has limited access to mental health facilities, and when using the measure tool we discovered that the next facility also serving Veterans is almost 140 miles away. Overall, we know the area of focus is on the 4th quantile of access to mental health providers, but the location of facilities map layer further guides us on the opportunities to serve areas with low access.
More to Explore
Ultimately, there are various ways to use SparkMap’s Map Room and Community Assessment due to the many data and tool resources, such as the Upload Data or the Measure Tool. SparkMap’s resources can identify problem and opportunity areas and serve as evidence for when applying for grants, such as the Community Mental Health Services Block Grant (MHBG) by SAMHSA, and other funding resources. If you have any questions, don’t hesitate to chat with us or visit support for more information.
Sources:
1. https://www.frontiersin.org/articles/10.3389/fpsyt.2020.00767/full
2. SAMHSA’s $825 Million and $3 Billion funding.
Support:
3. Learn how to make a map or navigate in our map room here.
4. Learn how to make an assessment and how to use it jointly with the map room in our blog.
5. Learn how to upload your data here.