New Census 2020 Redistricting Data Available!
On August 12, the U.S. Census Bureau released the most comprehensive set of data yet from the 2020 census. Demographic data was released at the “census block” level, which is the smallest unit of geography the census defines for public use [1]. Data from the release includes total population counts for each race/ethnicity and counts for those individuals over the age of 18. States can now use these data, before the full Census 2020 release, to help draw new political district boundaries. In most states, the state legislature is responsible for drawing both state and congressional district boundaries. By law, districts should be made up of approximately the same number of people, but the data from this release is used to draw the district boundaries, block by block.

What are the biggest changes since the last Census?
Aside from redistricting, the data in this release gives us a glimpse into how our communities and states are changing. Across the U.S., we are seeing a continued shift of the population from rural areas to more urban areas. Around 52% of counties in the U.S. saw population decrease, while metro areas grew by a combined 9%. Changes in how the questions around race and ethnicity included in the census were framed, and changes in how the answers were processed and coded, revealed a more diverse nation than previously measured.
The recent data release also included counts for the adult population (18 or over) and showed that the adult population has grown at a disproportionate amount to the overall population, meaning that the country as a whole is aging. All of these measures have implications in the realms of public health and safety, agriculture, the environment, economics, and education and will influence policy, program funding, and business investments for the next 10 years.
How to take advantage of SparkMap and the new Census Data?
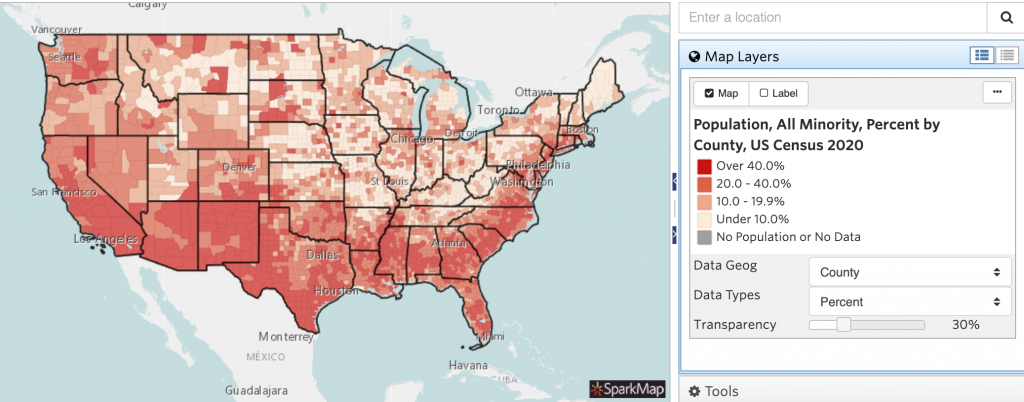
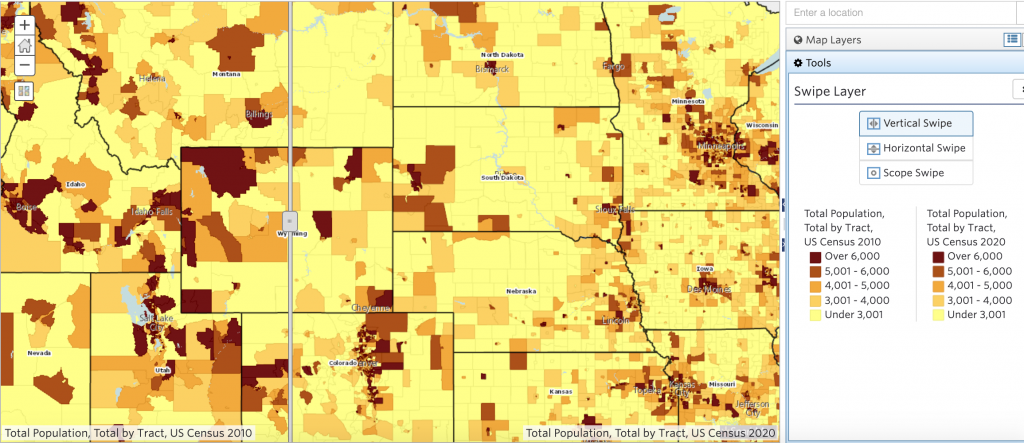
We have race/ethnicity layers loaded into our Map Room on Sparkmap! You can view these layers and use our tools to help compare changes, such as our swipe tool below where you can swipe between total population layers from 2010 and 2020.
You can also select data, query layers to show specific attributes, layer new data on top, + more! Check out how you can use all our data and tools in our Support page.
Resources
- Census Block Definition: https://www.census.gov/newsroom/blogs/random-samplings/2011/07/what-are-census-blocks.html
- Census Press Release: https://www.census.gov/newsroom/press-releases/2021/population-changes-nations-diversity.html
- Race and Ethnicity Changes: https://www.census.gov/library/stories/2021/08/improved-race-ethnicity-measures-reveal-united-states-population-much-more-multiracial.html