
Data Dive: Radon
Radon is a colorless, odorless gas that can naturally build up in homes and buildings.1 Breathing it in high levels can be dangerous over time and is the second leading cause of lung cancer in the US.2 Therefore, understanding where high levels of radon are located can inform your due diligence for health infrastructure development and community health interventions.
In this blog, we’ll answer the following questions:
What data are described here?
What do these data tell me?
How can I interpret these data?
Where can I access the data?
Where can I find more information?
Let’s dive in!
What data are described here?
SparkMap pulls radon data from two different sources. To learn more about Radon Zones, we have incorporated a layer from the Environmental Protection Agency into the Map Room. To learn more about Radon Levels, Buildings Tested, and High Radon Level monitoring, we have incorporated a Radon Levels indicator from the Centers for Disease Control and Prevention National Environmental Public Health Tracking Network into the Community Needs Assessment for Pro and Premium subscribers.
What do the radon data tell me?
What you learn from the data depends on how you access it.
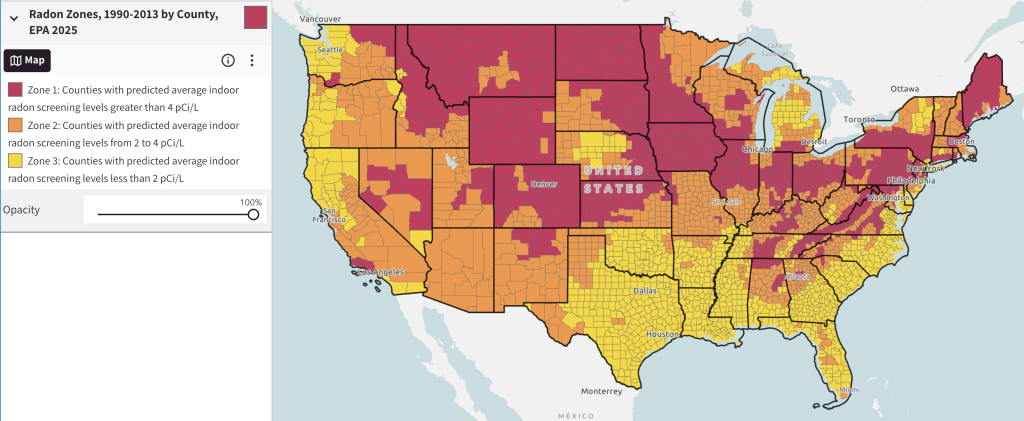
- Radon Zones in the Map Room: This free map layer shows the predicted screening levels for buildings in counties across the US. The map intends to help governments and other organizations target risk reduction activities and resources.
- Radon Levels in the Community Needs Assessment: This indicator is available to Pro and Premium subscribers and provides three main pieces of information.
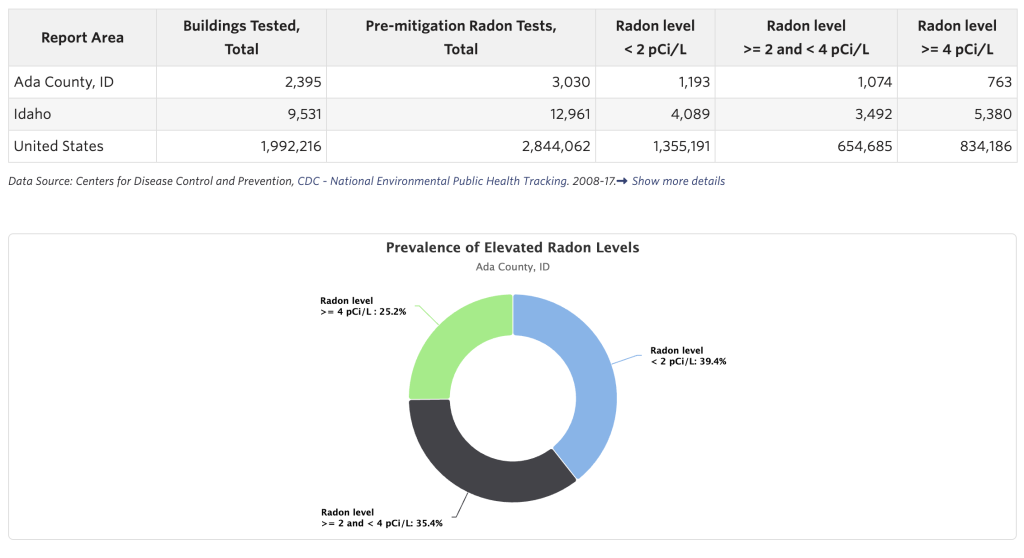
- Radon levels: The total number of buildings tested for an area, the rate of buildings tested, and the mean, median, and maximum radon levels found.
- Prevalence of elevated radon levels: The proportion of buildings tested with elevated radon levels.
- High radon levels: Historic radon levels to provide a timeline from 2005 – 2017.
How can I interpret these data?
Although the data look at radon levels in different ways, you can interpret them similarly. When it comes to radon, the higher the number, the more elevated radon levels exist. On the map, Zone 1 is characterized by indoor radon screening levels of greater than 4 pCi/L. On the other hand, Zone 3 areas are characterized by indoor screenings of less than 2 pCi/L. Therefore, one can expect buildings in Zone 1 to have higher levels of radon exposure than those in Zone 3.
Where can I access the data?
Access radon data in the Map Room for free or in the Community Needs Assessment with a Pro or Premium subscription.
Where can I find more information on radon?
- https://www.epa.gov/radon
- https://www.epa.gov/radon/epa-map-radon-zones-and-supplemental-information