2025 Year in Review
Access to reliable data became more important than ever before in 2025. As questions rose around data availability, updates, and reliability, SparkMap remained your trusted data provider. We are proud to continue this mission into 2026 and partner with you on supporting the change you’re making in communities around the country.
The year ahead will bring exciting changes to SparkMap! A glimpse of what you can expect includes: enhanced digital accessibility, timely blogs and webinars, and even more flexible subscription options. While SparkMap will grow and change this year, one thing remains the same: our commitment to providing timely, relevant, and usable data.
Let’s draw some inspiration for the new year by looking at all you accomplished in 2025.
50,433 Maps made in 2025!
In 2025, you made over 50,000 maps—that’s over 138 maps per day! You were most interested in learning about agricultural, population, and food access information for your communities. The National Commodity Crop Productivity Index 3.0 appeared in the most maps, breaking the three-year reign of the Vulnerable Populations Footprint as most-used layer. Other additions to the Top 5 Map layers in 2025 included 911 Service Area Boundaries, Overall Population, and Food Desert Census Tracts. These five layers accounted for 13.4% of the maps made in 2025. If you haven’t yet, be sure to check them out!

88,706 Community Needs Assessments made in 2025!
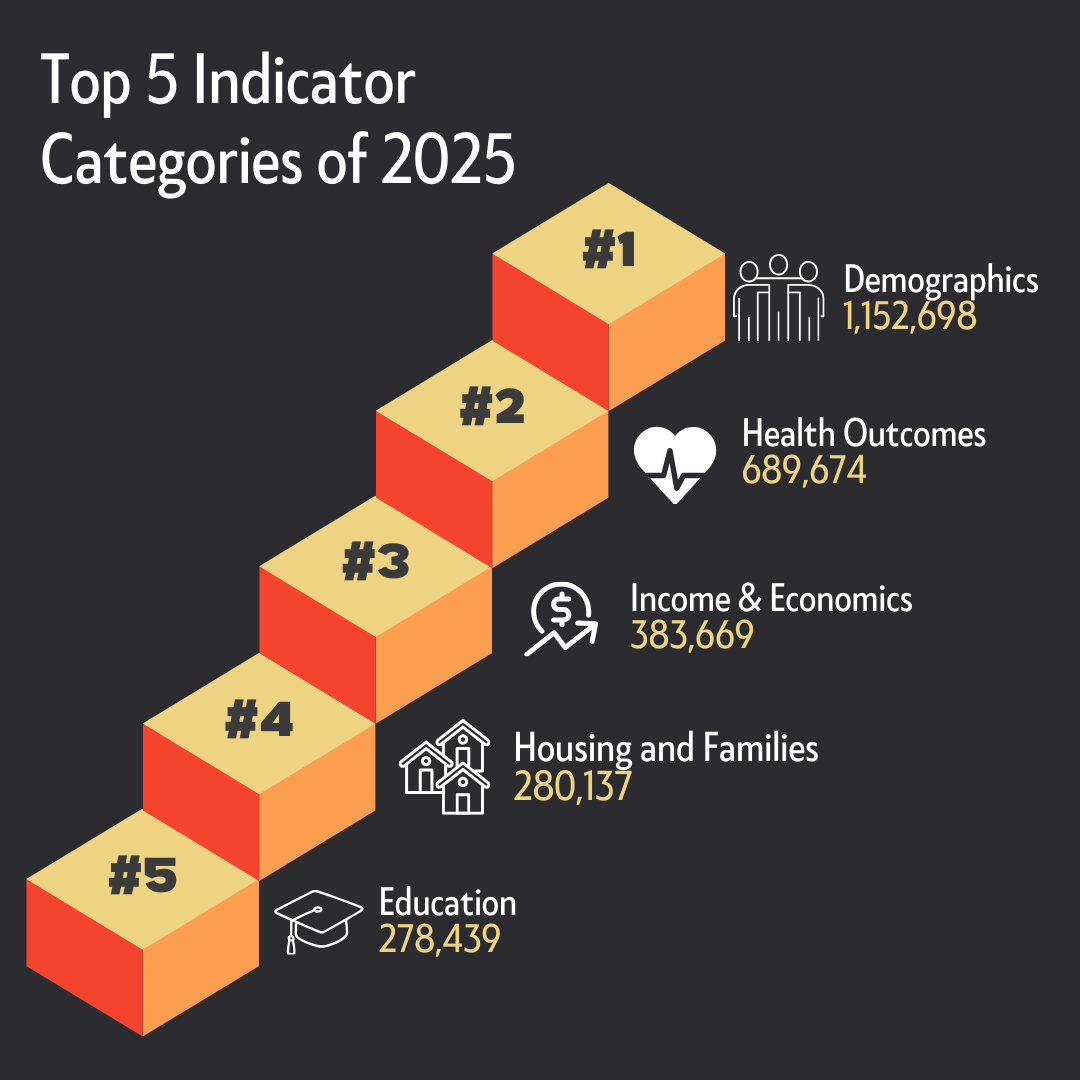
In 2025, you broke Community Needs Assessment records at SparkMap by creating reports with a combined 3.71 million indicators. The most popular indicator categories included Demographics, Income and Economics, and Housing and Families. The top-accessed indicators included Population Under 18, Poverty – Population Below 100% FPL, Urban and Rural Population, Housing Stock – Age, and Population with Limited English Proficiency. As you learned more about the makeup of your community, you also focused on their wellbeing by looking closely at Education, through Educational Attainment indicators, and Health Outcomes, by looking closer at Heart Disease, Diabetes, and Mortality. The Community Needs Assessment now has more indicators available than ever (424!!). Be sure to explore some new data as you work in 2026.