Skip to content
SparkMap logo with red/yellow gradient starburst to left of text
  • API
  • CreateExpand
    • Community Needs Assessment
    • Map Room
    • Old Map Room
  • NewsExpand
    • Blog
    • Data News
    • Events
  • DataExpand
    • Data News
    • Community Needs Assessment Indicator List
    • Indicator Breakouts
    • Map Data List
  • IndustryExpand
    • Health
    • Non-Profits
    • Government
    • Use Cases
  • SupportExpand
    • Community Needs Assessment
    • Map Room
    • API
    • Glossary
    • Examples & Resources
  • Pricing
  • Login/Register
SparkMap logo with red/yellow gradient starburst to left of text

Special Topic

Decorative image
Broadband

All About Broadband

ByJustin Krohn September 18, 2023September 18, 2023

What is broadband and how can you learn more about it on SparkMap? In this blog post we walk you through defining broadband, understanding how a broadband connection is impacted, and using broadband data on SparkMap.

Read More All About BroadbandContinue

W.E.B. Du Bois' Illustration
Data | Special Topic

W.E.B. Du Bois & Data Visualization History

ByJordan Rhodes June 9, 2022May 22, 2023

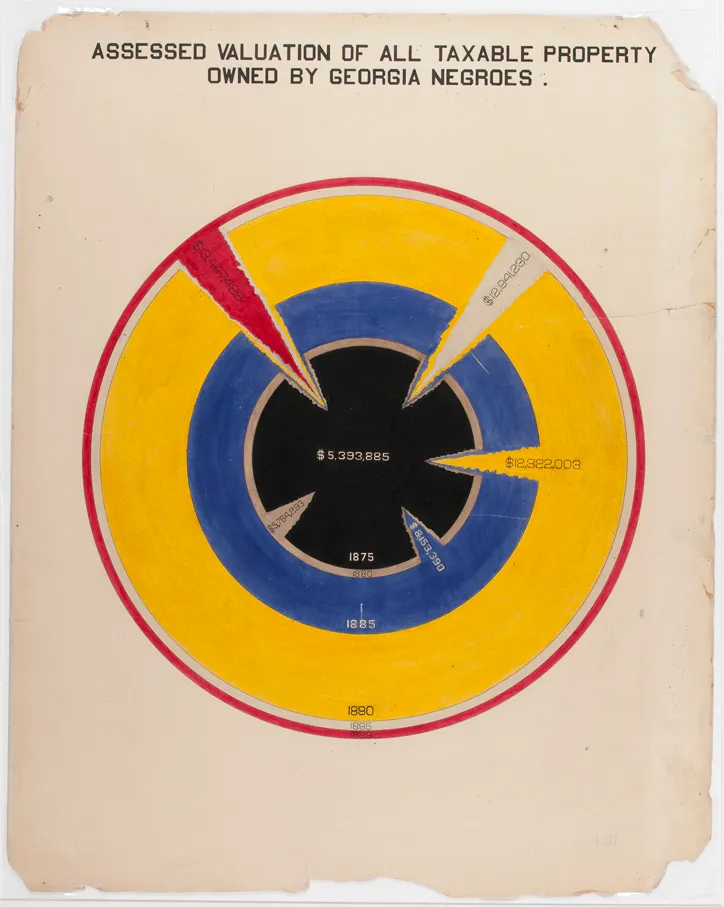
In this blog we discuss history of data visualization with a particular focus on the fascinating work of W.E.B. Du Bois.

Read More W.E.B. Du Bois & Data Visualization HistoryContinue

Cartoon image of commuting with cars, busses, trucks, pedestrians, and bikers.
Economic | Environment | Health | Special Topic

The Health, Environmental, and Economic Impacts of Commuting

ByJustin Krohn March 11, 2022May 22, 2023

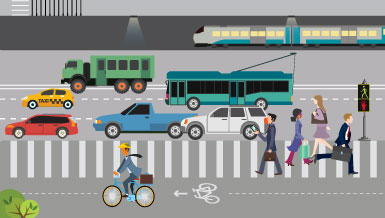
Commuting to work has significant impacts on personal health, the environment, and the economy. Learn more with SparkMap data in this blog!

Read More The Health, Environmental, and Economic Impacts of CommutingContinue

pie chart made of cartoon people
Data | Special Topic

Advancing Demographics: Expanding Race and Ethnicity Measures in the US Census

ByShaye Morrison February 25, 2022June 8, 2023

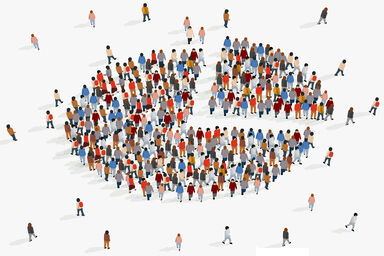
The US Census Bureau has changed demographic questions in response to a changing country. Read more about how these changes reflect increased diversity of Americans, why these modifications matter.

Read More Advancing Demographics: Expanding Race and Ethnicity Measures in the US CensusContinue

image of drawn hearts
Health | Map Room

Heart Disease – Designing Community Interventions

ByMelissa De Bartolomeo February 14, 2022June 8, 2023

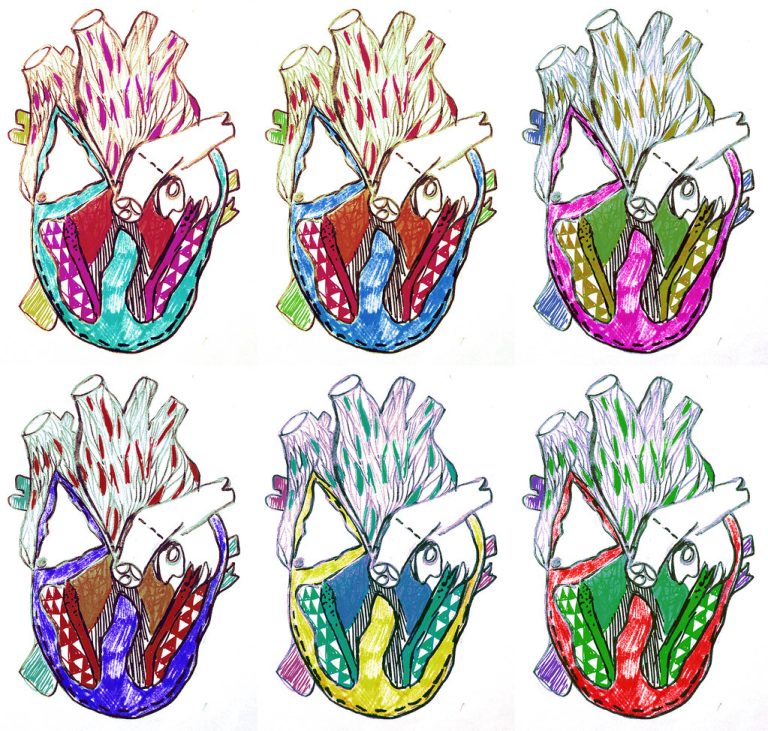
Heart disease is the leading cause of death in the United States. How can we use maps and data to understand where our most at-risk communities are and what interventions may help?

Read More Heart Disease – Designing Community InterventionsContinue

holiday tag with "to" and "from"
Data | Map Room | Special Topic

Hyperlocal data in the Map Room – looking for Nonprofits near me

ByMelissa De Bartolomeo December 9, 2021June 8, 2023

Learn how to use the Select Data tool in the Map Room to see data in context of a specific region or distance from a point. In this example, we’ll look at the data for 501(c)(3)s and (c)(4)s that are within 1 mile of an address.

Read More Hyperlocal data in the Map Room – looking for Nonprofits near meContinue

medical equipment for diabetes control
Health | Special Topic

Diabetes: Assessing Risk Amidst the Pandemic

ByElisa c November 10, 2021June 8, 2023

People with Type 1 and Type 2 diabetes are more likely to develop serious cases of COVID-19, including hospitalization, than those who don’t have diabetes. But, how can healthcare providers identify those with diabetes and determine strategies to support them? SparkMap can help!

Read More Diabetes: Assessing Risk Amidst the PandemicContinue

SparkMap logo

a product of:

CARES - University of Missouri logo

ABOUT

DATA

PRIVACY POLICY/TERMS OF SERVICE

PRICING

SUPPORT

CONTACT

FOLLOW US

© 2025 Curators of the University of Missouri, all rights reserved, DMCA and other copyright information. University of Missouri Extension is an equal opportunity/access/affirmative action/pro-disabled and veteran employer.

  • API
  • Create
    • Community Needs Assessment
    • Map Room
    • Old Map Room
  • News
    • Blog
    • Data News
    • Events
  • Data
    • Data News
    • Community Needs Assessment Indicator List
    • Indicator Breakouts
    • Map Data List
  • Industry
    • Health
    • Non-Profits
    • Government
    • Use Cases
  • Support
    • Community Needs Assessment
    • Map Room
    • API
    • Glossary
    • Examples & Resources
  • Pricing
  • Login/Register