Skip to content
Ready to connect our data to your database? Learn more about the SparkMap API!
SparkMap logo with red/yellow gradient starburst to left of text
  • API
  • CreateExpand
    • Community Needs Assessment
    • Map Room
  • NewsExpand
    • Blog
    • Data News
    • Events
  • DataExpand
    • Data News
    • Community Needs Assessment Indicator List
    • Indicator Breakouts
    • Map Data List
  • IndustryExpand
    • Health
    • Non-Profits
    • Government
    • Use Cases
  • SupportExpand
    • Community Needs Assessment
    • Map Room
    • API
    • Glossary
    • Examples & Resources
  • Pricing
  • Login/Register
SparkMap logo with red/yellow gradient starburst to left of text

pills

Map of the eastern portion of the United States showing opioid pills per capita

Opioid Pills Per Capita

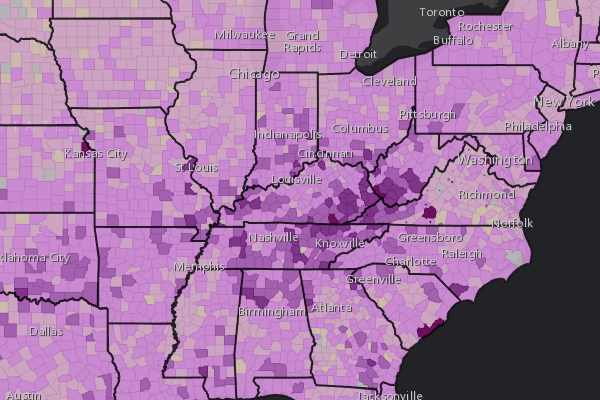
Opioid pills per capita by county. Add mental health care providers, law enforcement prevalence, and substance abuse facilities to better understand how the opioid crisis is affecting your community.

Read More Opioid Pills Per CapitaContinue

SparkMap logo

a product of:

CARES - University of Missouri logo

ABOUT

DATA INFO

PRIVACY POLICY/TERMS OF SERVICE

PRICING

SUPPORT

CONTACT

FOLLOW US

© 2025 Curators of the University of Missouri, all rights reserved, DMCA and other copyright information. University of Missouri Extension is an equal opportunity/access/affirmative action/pro-disabled and veteran employer.

  • API
  • Create
    • Community Needs Assessment
    • Map Room
  • News
    • Blog
    • Data News
    • Events
  • Data
    • Data News
    • Community Needs Assessment Indicator List
    • Indicator Breakouts
    • Map Data List
  • Industry
    • Health
    • Non-Profits
    • Government
    • Use Cases
  • Support
    • Community Needs Assessment
    • Map Room
    • API
    • Glossary
    • Examples & Resources
  • Pricing
  • Login/Register