Population Change, Census 2020 Data
Which populations have increased or decreased in the last 10 years? Access to population changes based on race and/or ethnicity from the newly released 2020 Census Data.

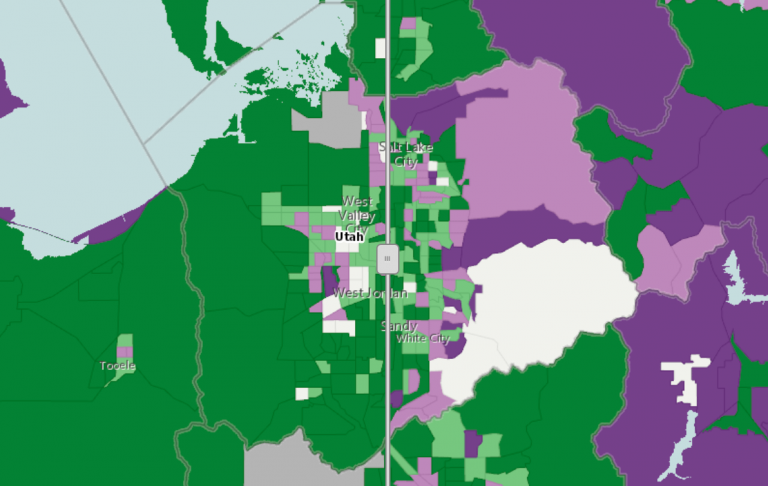
Which populations have increased or decreased in the last 10 years? Access to population changes based on race and/or ethnicity from the newly released 2020 Census Data.
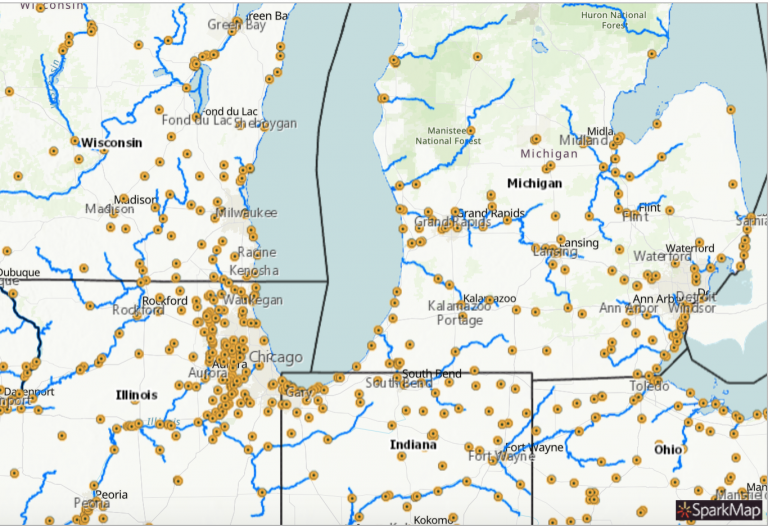
Water pollution discharge sites in relation to bodies of water. Add layers about top commodities produced or number of farms at the county level.
Poor mental health percentage among adults 18+ at the ZCTA level. Compare it to available mental health facilities. Add unemployment rates, opioid pills per capital, demographics, and more to learn about your location.
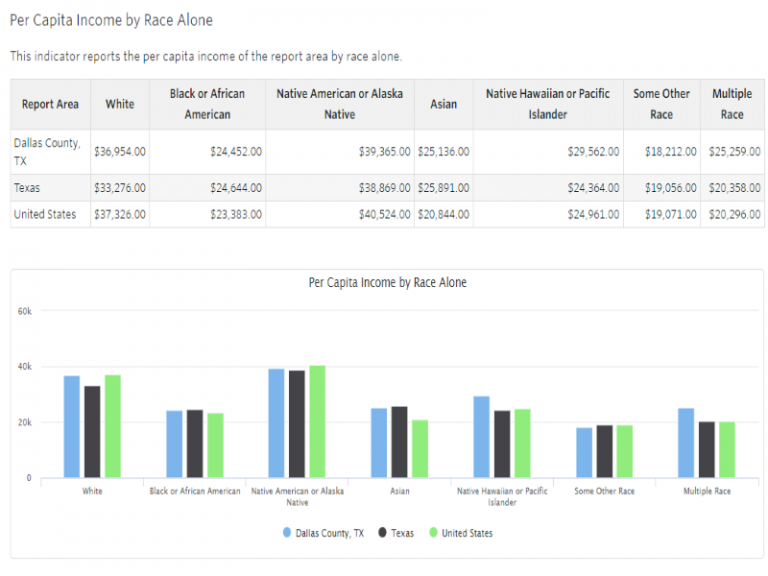
This assessment contains general business indicators. Switch back to step 1 and choose your location. See where your area stands in terms of income, educational attainment, housing, as well as built and food environments.
Explore trends over time for unemployment, poverty data with gender and ethnicity breakouts, and access to motor vehicles – change the assessment location to better understand your target community.
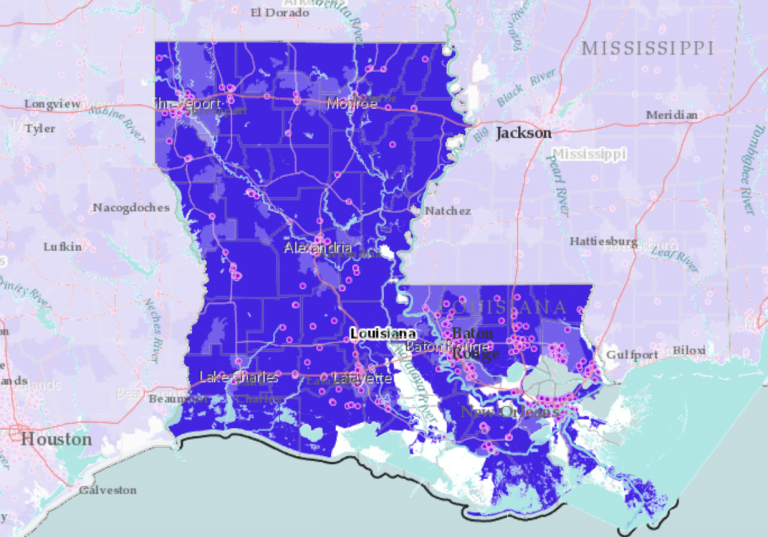
Incarceration rates by census tract. Add crime statistics, number of law enforcement officers, and demographics to learn more about a sub-population.