Skip to content
Ready to connect our data to your database? Learn more about the SparkMap API!
SparkMap logo with red/yellow gradient starburst to left of text
  • API
  • CreateExpand
    • Community Needs Assessment
    • Map Room
  • NewsExpand
    • Blog
    • Data News
    • Events
  • DataExpand
    • Data News
    • Community Needs Assessment Indicator List
    • Indicator Breakouts
    • Map Data List
  • IndustryExpand
    • Health
    • Non-Profits
    • Government
    • Use Cases
  • SupportExpand
    • Community Needs Assessment
    • Map Room
    • API
    • Glossary
    • Examples & Resources
  • Pricing
  • Login/Register
SparkMap logo with red/yellow gradient starburst to left of text

economic

Map of gross domestic product percent change from previous year by county in Oklahoma

Gross Domestic Product Change by County

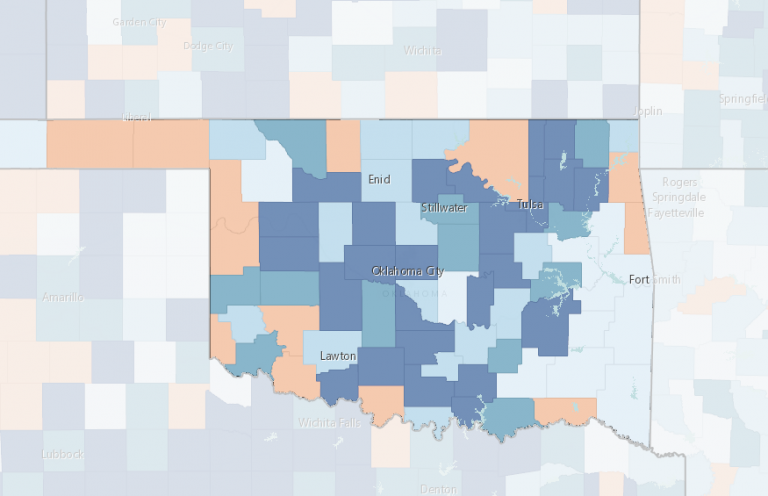
Gross domestic product by county, percent change from previous year. Add median household income, unemployment, or labor force participation to explore local economies more deeply.

Read More Gross Domestic Product Change by CountyContinue

SparkMap logo

a product of:

CARES - University of Missouri logo

ABOUT

DATA INFO

PRIVACY POLICY/TERMS OF SERVICE

PRICING

SUPPORT

CONTACT

FOLLOW US

© 2025 Curators of the University of Missouri, all rights reserved, DMCA and other copyright information. University of Missouri Extension is an equal opportunity/access/affirmative action/pro-disabled and veteran employer.

  • API
  • Create
    • Community Needs Assessment
    • Map Room
  • News
    • Blog
    • Data News
    • Events
  • Data
    • Data News
    • Community Needs Assessment Indicator List
    • Indicator Breakouts
    • Map Data List
  • Industry
    • Health
    • Non-Profits
    • Government
    • Use Cases
  • Support
    • Community Needs Assessment
    • Map Room
    • API
    • Glossary
    • Examples & Resources
  • Pricing
  • Login/Register