
Indicator Breakout Examples
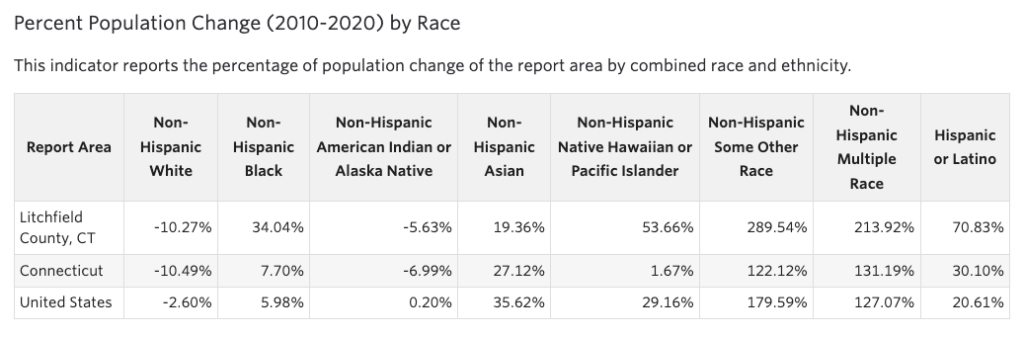
Change in Total Population, 2010-2020: the total population indicator includes breakouts for standard race categories – White, Black, American Indian or Alaska Native, Asian, Native Hawaiian or Pacific Islander, Some Other Race, Multiple Race. Learn more about how race is defined here. Racial group breakouts can be used make statements like, “Our city has experienced a 19% increase in people who identify as Asian since the 2010 Census.”
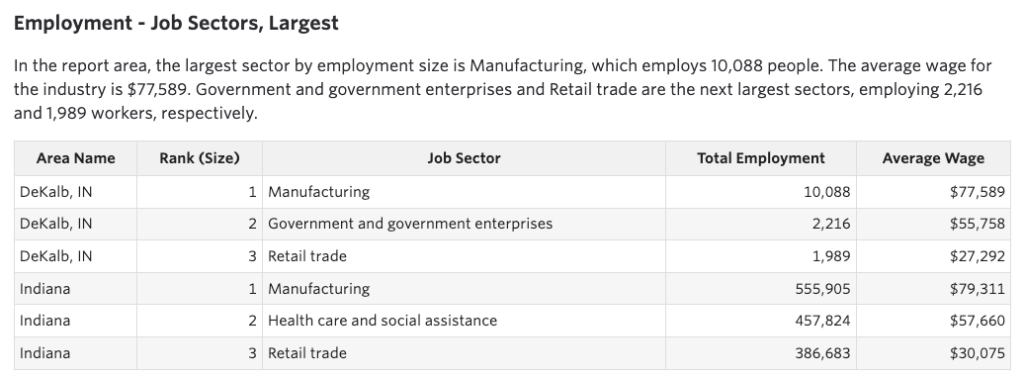
Largest Job Sectors: the largest job sectors indicator includes two breakouts – total employment and average wage. Job sector data can be used to make statements like, “Manufacturing is both the largest and highest wage job sector in our region. The second largest job sector is government, but the average wages are much lower.”
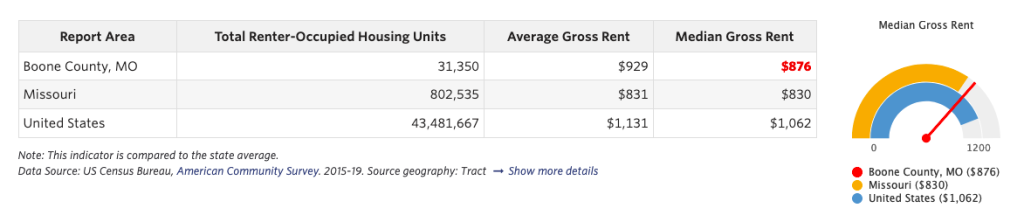
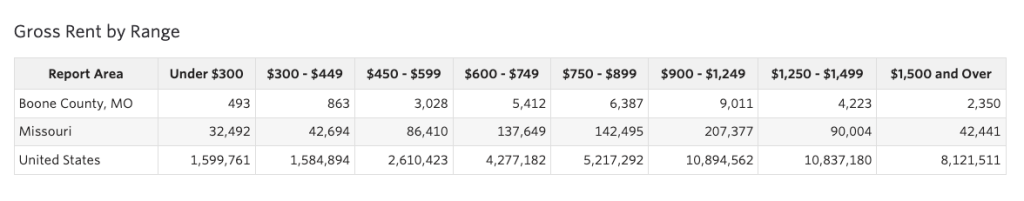
Renter Costs: this indicator provides data for average gross rent and median gross rent. Additionally, the indicator provides supplemental data that show how many rental units fall within each cost category – Under $300, $300-$449, $450-$599, $600-$749, $750-$899, $900-$1,249, and $1,500+. Housing cost data can be used to state a community need like, “Rental units priced in the $900-$1,249 make up the largest portion of available rental units in Boone County. Future construction should focus on increasing availability in the $600-$749 and $750-$899 cost categories.”
Have questions? Check out our support page or contact us at sparkmap@missouri.edu.