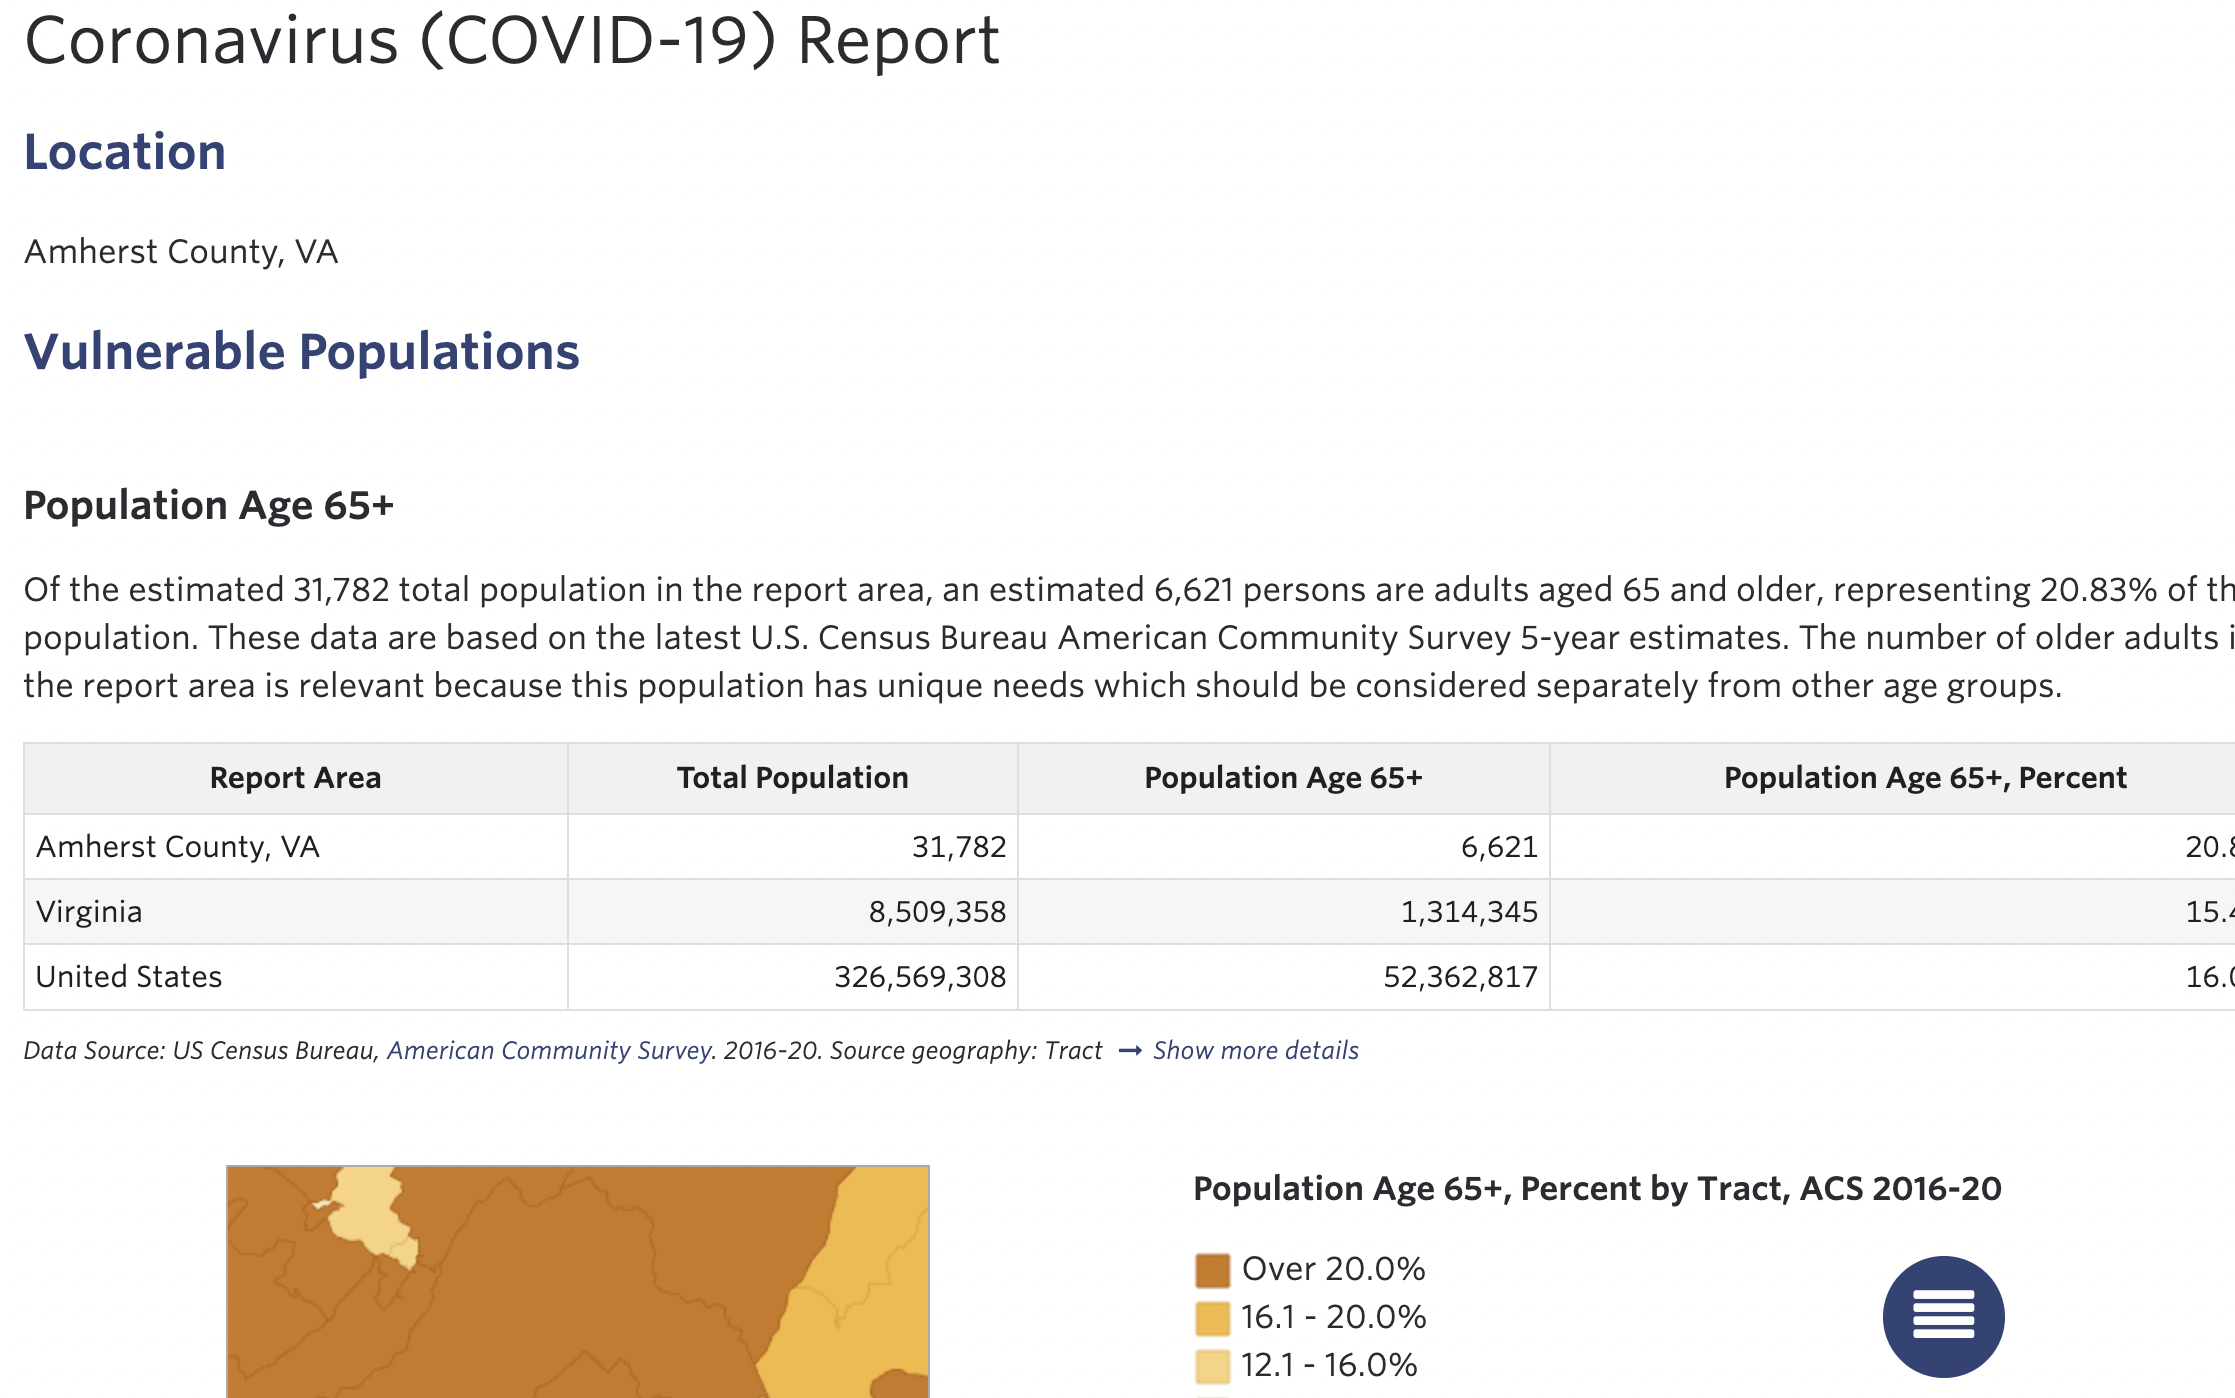
Learn more about COVID-19 trends, impacts and related vulnerabilities – the following resources use real-time and national secondary source data to highlight the influence of COVID-19.
COVID-19 Resources

COVID-19 Hospital Bed Dashboard
How full are hospitals near you? Access the dashboard to see how many hospital beds are in use by COVID-19 patients as a percentage of overall usage and see the overall facility capacity.

COVID Vulnerability Assessment
Explore vulnerable populations in context of COVID-19. Available indicators include older populations, uninsured populations, economic vulnerability, and COVID-19 case data.

COVID-19 Vaccination Dashboard
This dashboard shows the total number of COVID-19 vaccines distributed and administered in each state. The dashboard includes a map of vaccines administered in each state, and a chart with daily administration trends over the last 10 days. Data is from the Center for Disease Control and Prevention (CDC) obtained through Our World in Data.

New COVID-19 Cases in the Last 14 Days
This swipe map shows the number of new COVID-19 cases in the last 14 days as well as the percent change in overall cases from 14 days ago.

National COVID-19 Dashboard
The National Covid-19 dashboard provides a snapshot of COVID-19 cases across the nation as well as vulnerability indicators for counties. Use the tabs at the bottom left of the dashboard to navigate between the maps and the various indicators.

COVID-19 Vulnerability Footprint
The COVID-19 Vulnerability Footprint identifies vulnerable communities across the nation, defined as having high concentrations of older populations, the uninsured, and high population density. Thresholds for target area identification are adjustable, allowing the tool to be utilized in all geographic areas where regional rates may be higher or lower than the national average.

COVID-19 Cases by County and ICU Beds
COVID-19 confirmed cases by county (centroid) and the number of Intensive Care Unit (ICU) beds in a 20 mile radius. Add testing locations and hospitals to visualize healthcare access and COVID response.

COVID-19 Starter Map: Economic Impact
This starter Map features Economic information including Median Household Income, Population Below the Poverty Level, Households with No Internet, Broadband Internet Usage, as well as confirmed COVID-19 cases and deaths from the John Hopkins University.

COVID-19 Starter Map: Demographic Vulnerability
This starter Map features Demographic information including Disabled Population, Median Age, Total Households, Total Population as well as confirmed COVID-19 Cases and Deaths from the John Hopkins University.

COVID-19 Starter Map: Hospitals, Confirmed Cases and ICU beds
Ip-to-date confirmed cases of COVID-19 by County from the John Hopkins Institute, as well as Hospital locations, ICU Beds within 20 Miles by census tract, and ICU Bed Utilization Rate per 100,000 population.